Just to put it on the public record. I have received a number of complaints from candiadtes an campiagn managers about the efficency or lack there of the VEC and their counting system.
QUOTE: "getting information out of them has been terrible this time around. I don't necessarily blame the people that i have been dealing with but their systems seem to be terrible eg i can't get anything like an idea of how many absentee votes there are this year"
I have left the name of the candidates office out to protect their identity but I thought it is worth blogging some of these comments could this could become a bigger issue if the results get close.
I should also point out that the number fo complaints I have received, most via the telephone, are not just comming from the Labor Party but other parties and individuals also. All the complaints point to one man.
The failure of the VEC to provide relevant and important information that should be public in this election has been one of the worst on record. Which is an indictment on the VEC Chief Commissioner, Steve Tully.
The VEC has spent millions of dollars duplicating a computerised voting system and they can not provide basic information such as "How many postal and absentee ballot papers have been issued for each district?" Ok I will give them some benefit of doubt over absentee votes, but only just, I will not give them and excuse for not providing the number of postal ballot papers issued per district. Postal vote application closed last Thursday and a ballot paper should not have been sent out until they have checked the name off the roll. So there should be a record of how many postal votes have been issued.
The failure of the VEC to provide this information indicates that they have a problem with tallying this information. There is no excuse and Steve Tully must share responsibility for not proving this data. His reputation certainly is on the line as a lot of campaign managers and candidates are talking about it and we are blogging it.

Monday, November 27, 2006

Sunday, November 26, 2006
Upper Tally Victorian Legislative Council Election
IMPORTANT UPDATE (Thursday November 5:30PM)
Change of fortune as predicted Southwick head South and takes the lead by the slimest of margins less then 150 votes and still counting (Click Here)
Click here for our latest analysis count datasheet details
UPDATE: (Monday November 27, 8:00PM)
Further analysis of the results as published by the VEC at 5:3OPM Monday November 27 indicates that postal, absentee and below the line votes will play a crucial role in the outcome of Western Victoria with a strong possibility of the DLP with the assistance of Family First could win the firth seat as as such deny the ALP absolute control in the Legislative Council. Other possible contenders are the National Party.

Analysis of the Summary Results of the Upper-House election.


Rural Victoria
Change of fortune as predicted Southwick head South and takes the lead by the slimest of margins less then 150 votes and still counting (Click Here)
Click here for our latest analysis count datasheet details
UPDATE: (Monday November 27, 8:00PM)
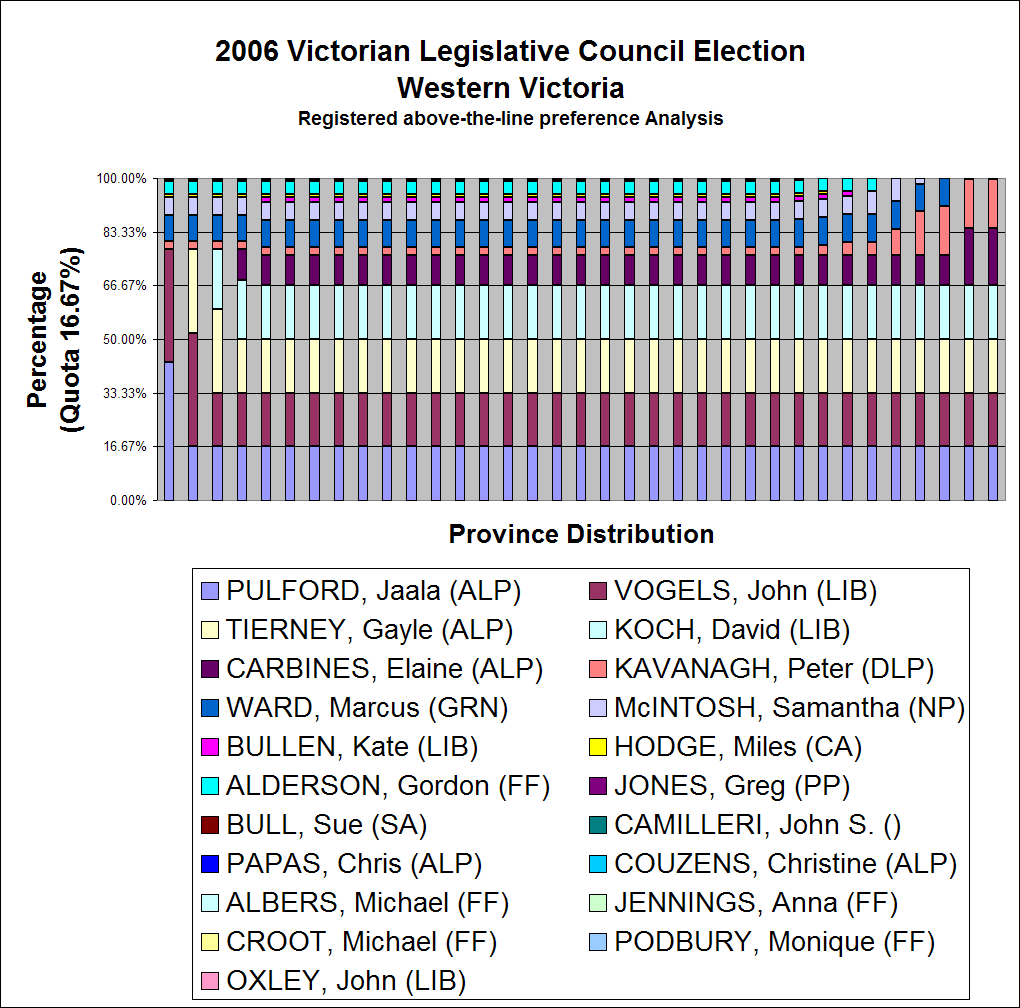
Further analysis of the results as published by the VEC at 5:3OPM Monday November 27 indicates that postal, absentee and below the line votes will play a crucial role in the outcome of Western Victoria with a strong possibility of the DLP with the assistance of Family First could win the firth seat as as such deny the ALP absolute control in the Legislative Council. Other possible contenders are the National Party.
Latest fugars available indicate that the ALP may pull ahead of the Green vote which will mean the ALP wins the fifth spot and a third seat giving it absolute control of the legislative Council. Its a sea-saw close race with five competitors competing to the finish line.
All depends on the outcome of the race between Family First and the DLP, the National Party and the DLP, and the Greens and the ALP. There are thee main conjunction points that exist in the count and the result could tip either way.
It is difficult to make any accurate assessment due to the refusal of the Chief Commissioner Steve Tully to ensure that the counting of the election is open and transparent and subject to detailed independent analysis. His refusal to provide postal vote, absentee and prepolling statistics on the number of votes issued and the failure of the VEC to provide detailed polling both data further complicates independent analysis leaving many candidates and campaign managers in the dark. Akin to driving around Australia with a word map and no idea of the scale or distance. There are also issues with the data-entry/data quality of the VEC data with an additional space omitted in the DLP group name.
With the results of the election determined by computers it is essential that this information and details of the recorded preference allocations are readily available and that our election system is open and transparent. Mr Tully's refusal to provide this information, as requested, in a timely fashion brings the conduct of state election count into disrepute.
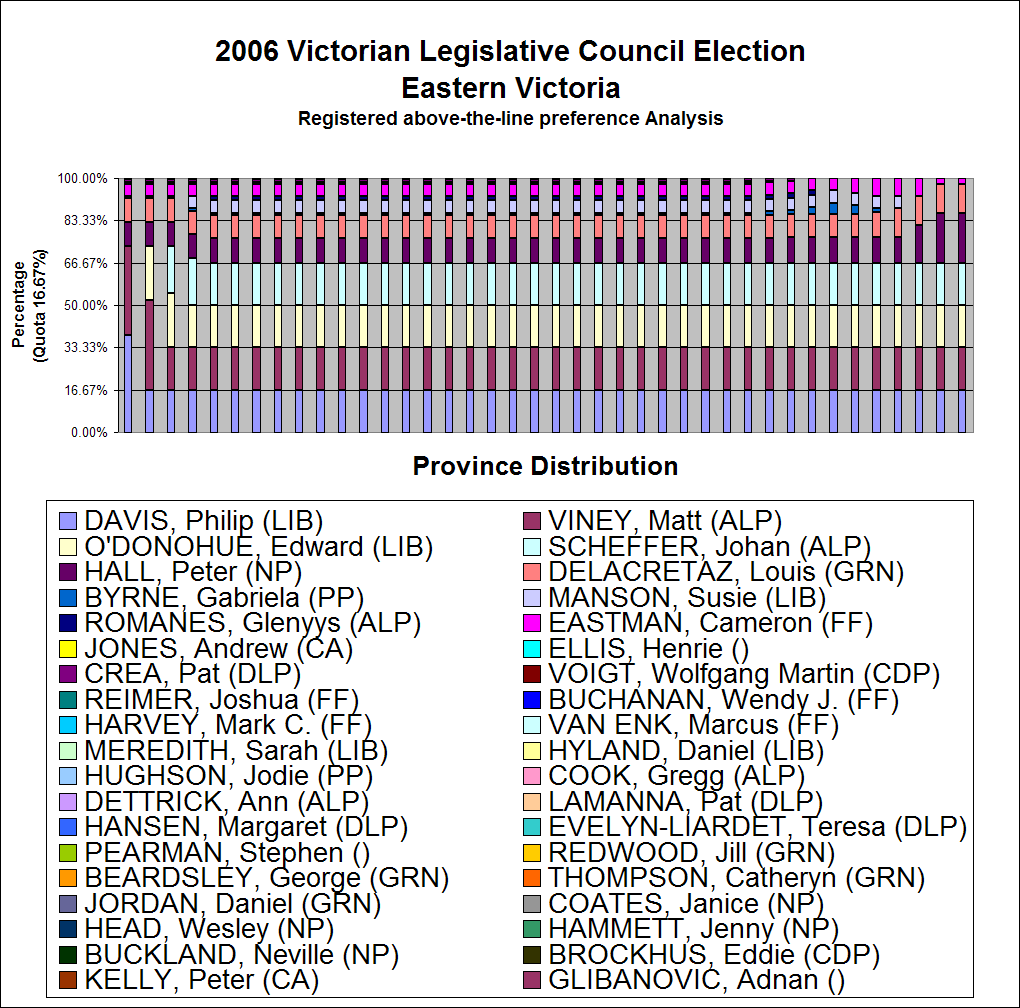
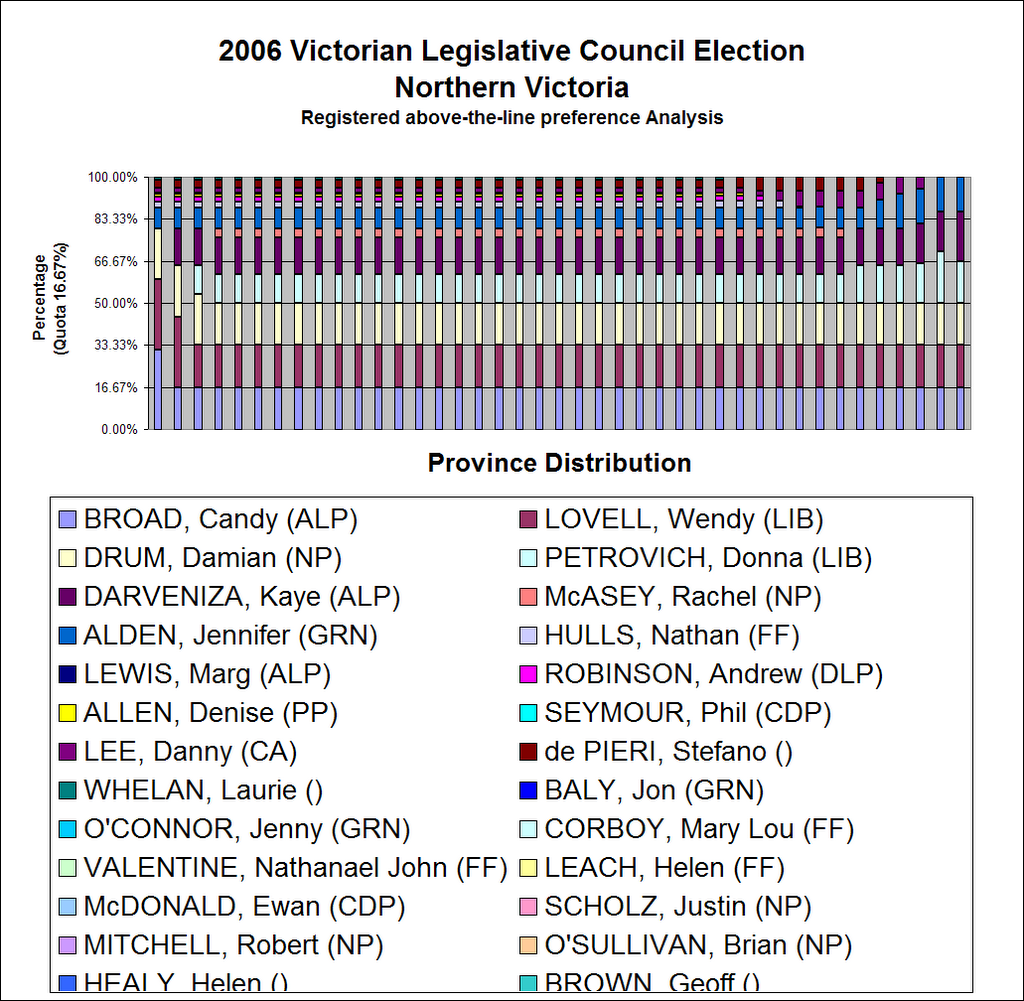
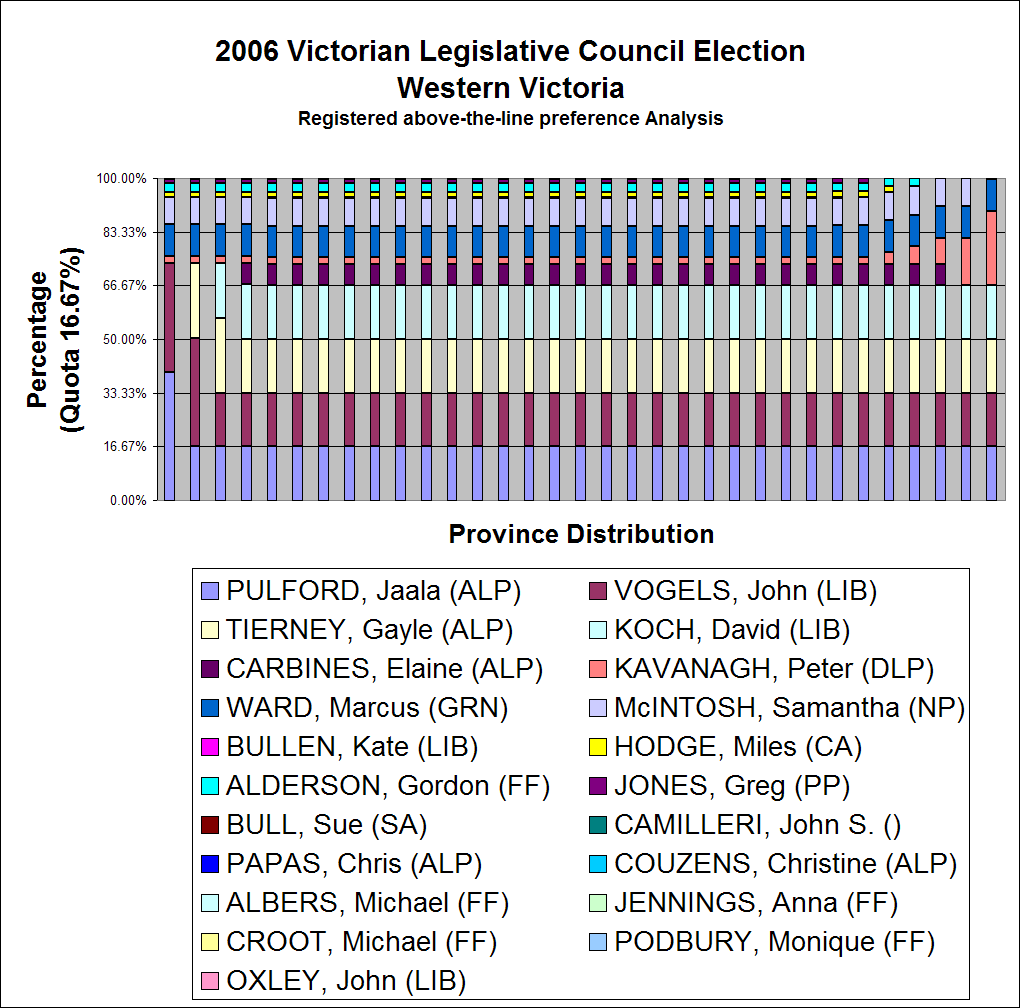
Attached below is a the latest theoretical distribution of below the line preferences.
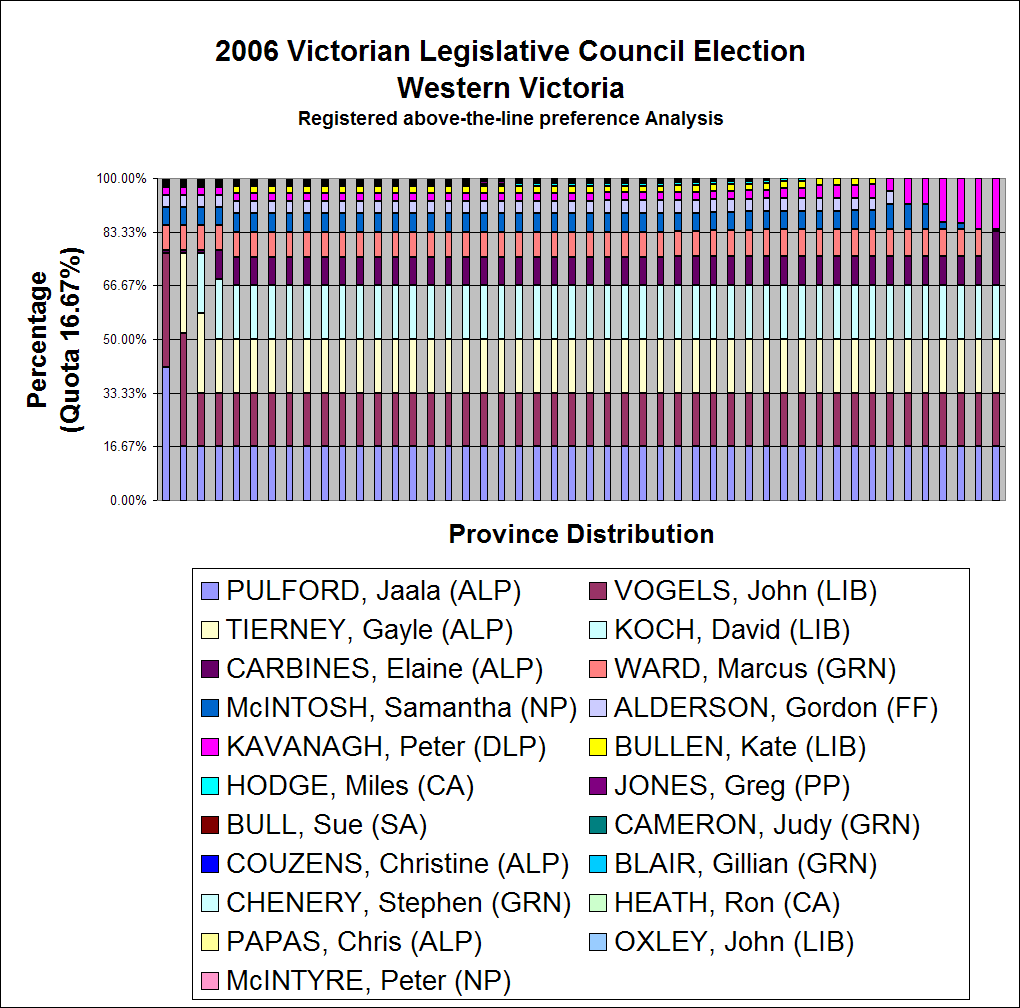
Analysis of the Summary Results of the Upper-House election.
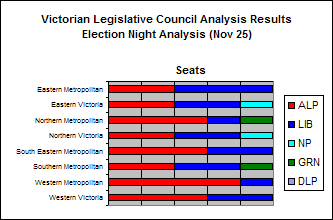
The following results of Saturday's count produced interesting reading as the results unfolded.
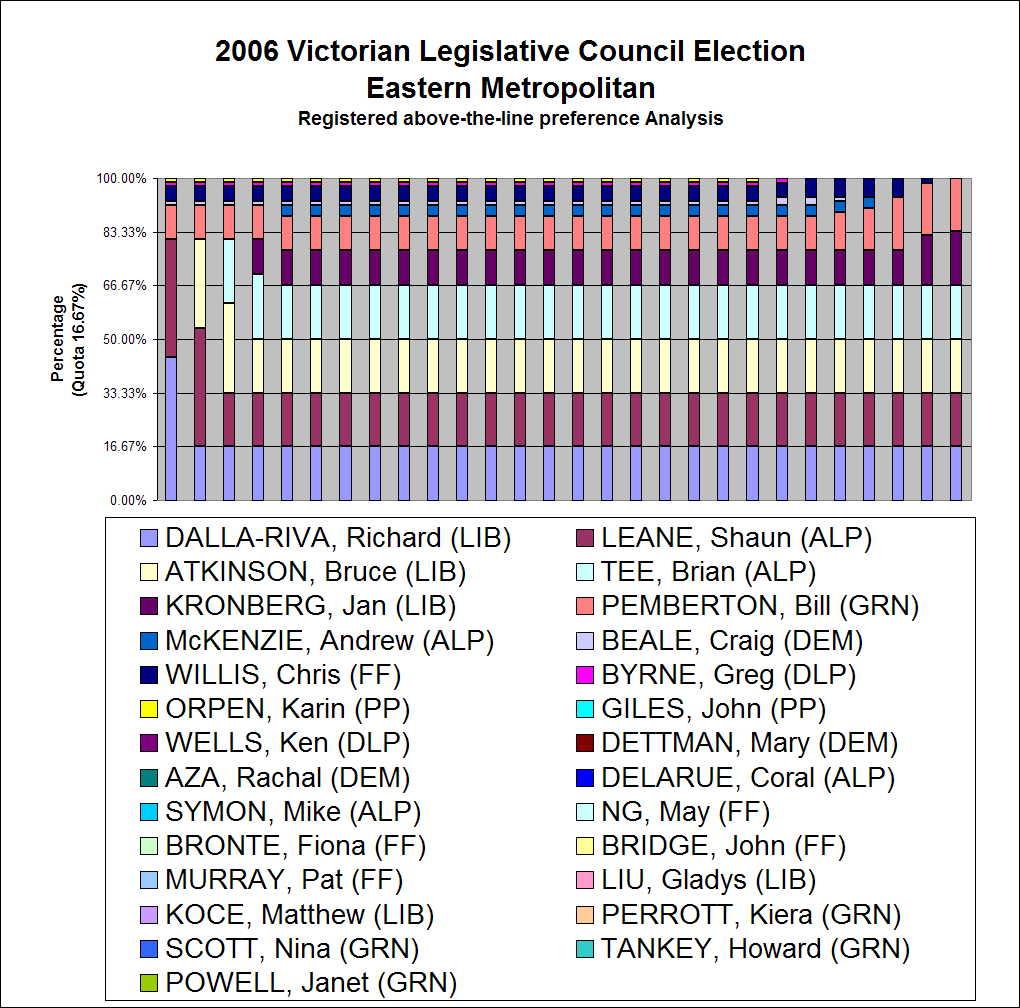
At one stage in the counting process it looked as though the Greens were going to lose all seats but as the count progressed the Greens, aided by People Power and Democrat feeders, crept across the line in two seats only (Southern and Northern Metro). Recent poll results have recorded a strong vote for Labor and the Liberals in Western and Eastern Metropolitan seats respectively. The gap has widened and with most of the vote counted it is difficult to see any change. As most of the parties have pretty much the same below the line vote it is difficult for any of the parties to bride that gap which is over 2,000 votes.
The election process was marred by the Chief Commissioner, Mr Steve Tully, who refused to provide information on the number of postal ballot papers that had been issued for each district. This information is normally available and provides an indication of what is outstanding and whether or not it will effect the results of the election. without this information there is no way knowing if that all illusive bundle of 50 votes will appear.
Mr Tully in spite numerous requests refused to make this important information available. WHY? Not having access to this basic information is akin to holding an election and not knowing the total number enrolled. If you do not know what has been issue how do you know what's missing.
This information is normally made available prior to the election postal vote applications closed on Thursday night. As a result of Mr Tully's refusal he left scrutineers of Monday nights count in the dark not knowing vital information as to whether or not Bronwyn Pike was elected or not. Bronwyn according to the VEC 2CP count was on a 1.5% margin similar to the 2002 election result but without knowing the number of postal votes that has been issued and the number of absentee votes yet to come in, she was left wanting.
The VEC’s conduct of the count of the election was certainly left wanting and raises question why do we need to 2 electoral commissions, the VEC and the AEC, this duplication is a waste of limited public resources. The web VEC’s site service was also inadequate with detailed information related to polling pace results not readily made available.
Further there were additional concerns that the Chief Commissioner and VEC staff had undertaken a, possibly illegal, preliminary early count of the results of the election recorded at electronic polling booths. If this is true then there are a number of questions outstanding in regards to the VEC’s rights to undertake a preliminary count of the election results prior to the close of the poll on Saturday night in the absence of scrutineers. If not resolved soon this issue will be subject to review by the Victorian Civil Appeals Tribunal and with the Chief Commissioner and staff called on to give evidence as to the conduct of the election with a report being made to the State Parliament.
Mr Tully has denied and refuted the advice provided by Glenda Fraser, Manager of Election Services, who in an email forward to the Media on Friday indicated that the Commission had in fact undertaken a count and analysis of first preference and 2CP results of votes recorded on the VEC electronic voting system. Quote: “After analysing the number of voting centre results entered last night for 1st prefs (District and Region) and 2 CP we have realised that everyone could be waiting around all night for what would be dribs and drabs that we do not anticipate would make an impact on the result” If it turns out that this account is true and the preliminary count was illegal then Mr Tully should resign or be sacked. A decision to sack Mr Tully would need to be made by the Victorian State Parliament.
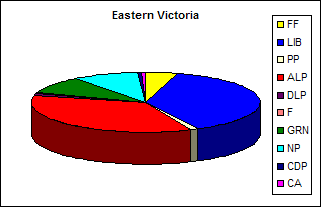
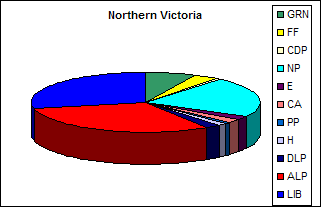
Results of of the close of early this morning (Sunday November 26)
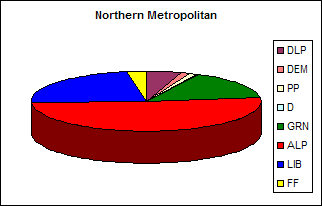
Metropolitan Seats (Click on the graphs below to view a larger version)

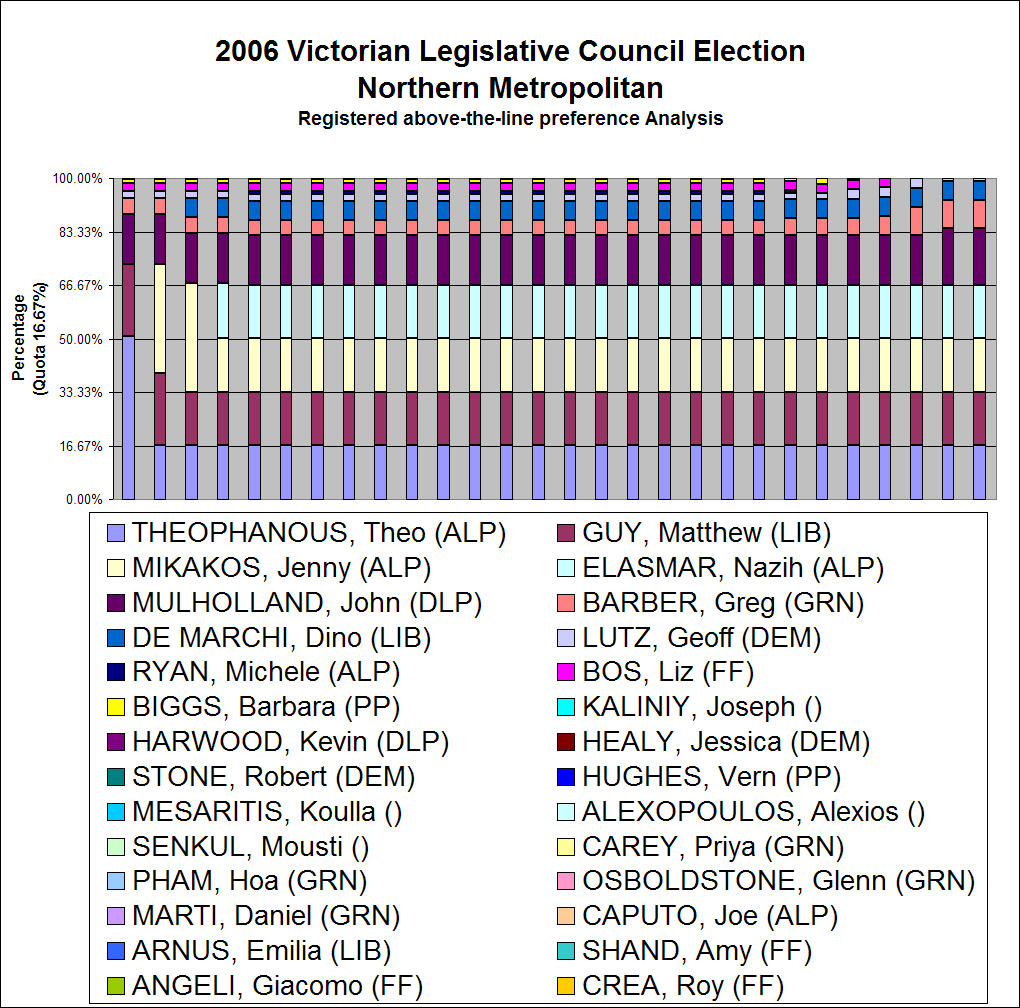
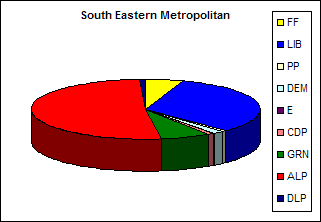


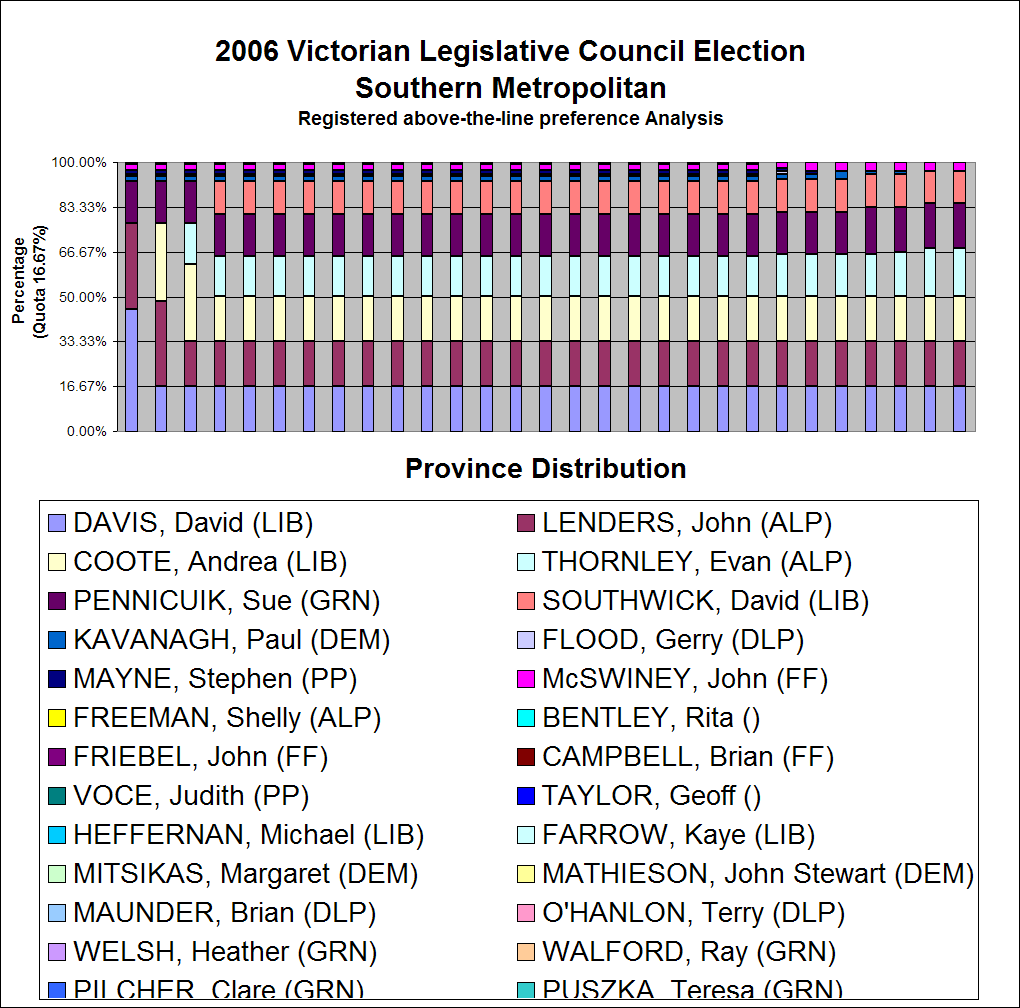

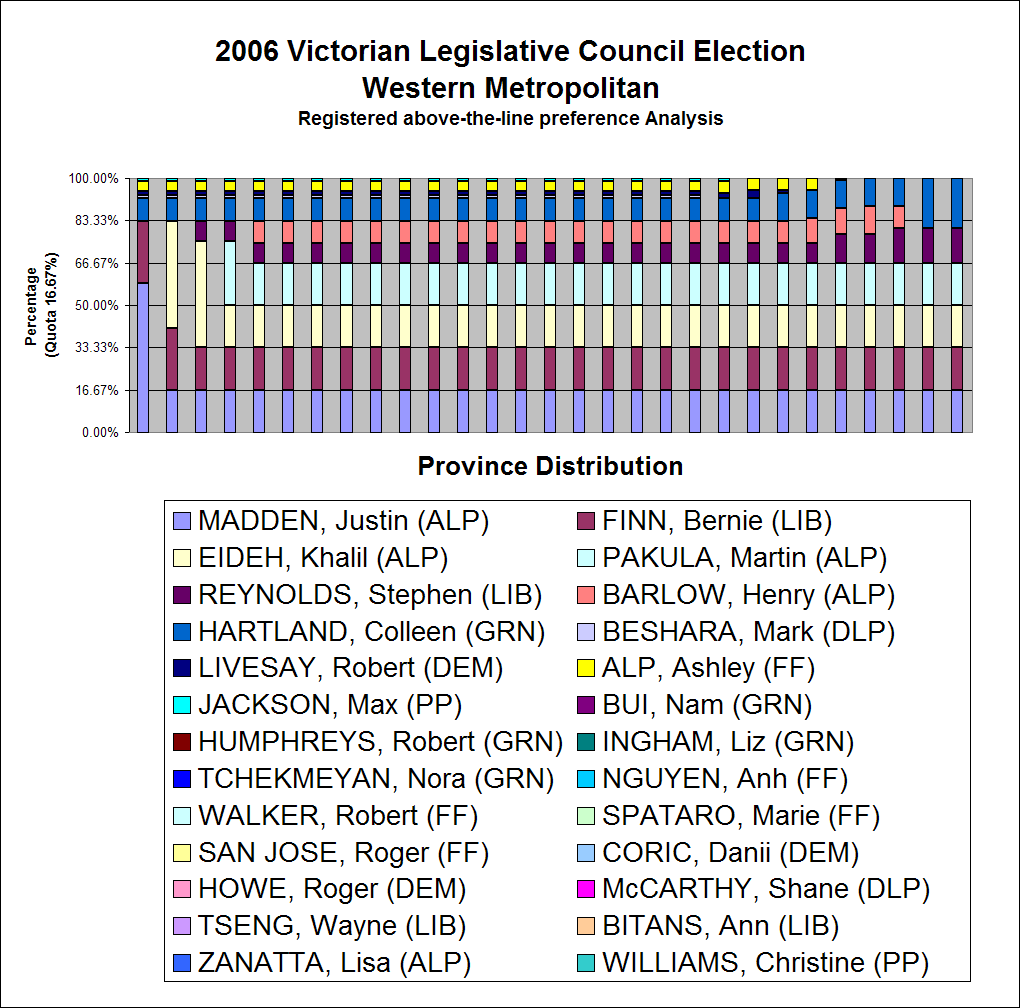
Rural Victoria
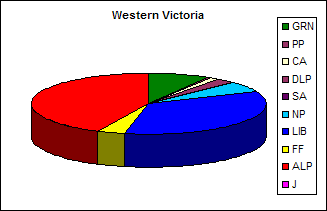
Saturday, November 25, 2006
Early results Results in to date show Labor is in a winning position
Early results indicate a safe win for Melbourne, Richmond and Prahran for the ALP.
23:00
Late vote return shows the Greens creeping over the line on People Power and Democrats Prefernces
Greens scrape in in Northgern. Southern and Western Metropolitan Regions confirming earlier preictaions based on the News poll with a surprise win in the Westsern etro seat as tyhe ALP misses out on a fourth spot.
Melbourhne will not be known for some time and there is concern that the VEC has failed to provide information on teh number of Postal Votes that have been issued. WHY we fail to understand. Overall the VEC web site was hopeless. Lacking the nessassary detail as is normally required. Many issues behind the scenes need to be reviewed.
Richmond:
The Liberal party is out polling the Greens in Richmond and as such Richmond will be a safe seat
Melbourne:
Bronwyn (ALP) is set to retain the seat of Melbourne after a strong campaign in the last week. Greens vote lower then in 2002.
Prahran:
Tony Lupton set to retain Prahran against expectations. Prahran is the litmus test seat. A great result which indicates that the ALP will retain government. Well done
Upper-house result with 35% counted
Northern Metropolitan:
Early indications are that the results are not as expected 3 ALP 1 Liberal 1 DLP
Southern Metropolitan:
Expected result 3 ALP 2 Liberal
23:00
Late vote return shows the Greens creeping over the line on People Power and Democrats Prefernces
Greens scrape in in Northgern. Southern and Western Metropolitan Regions confirming earlier preictaions based on the News poll with a surprise win in the Westsern etro seat as tyhe ALP misses out on a fourth spot.
Melbourhne will not be known for some time and there is concern that the VEC has failed to provide information on teh number of Postal Votes that have been issued. WHY we fail to understand. Overall the VEC web site was hopeless. Lacking the nessassary detail as is normally required. Many issues behind the scenes need to be reviewed.
Richmond:
The Liberal party is out polling the Greens in Richmond and as such Richmond will be a safe seat
Melbourne:
Bronwyn (ALP) is set to retain the seat of Melbourne after a strong campaign in the last week. Greens vote lower then in 2002.
Prahran:
Tony Lupton set to retain Prahran against expectations. Prahran is the litmus test seat. A great result which indicates that the ALP will retain government. Well done
Upper-house result with 35% counted
Northern Metropolitan:
Early indications are that the results are not as expected 3 ALP 1 Liberal 1 DLP
Southern Metropolitan:
Expected result 3 ALP 2 Liberal
Friday, November 24, 2006
Lost in e-Space Questions asked about security and probity of e-Voting centers go unanswered
The VEC has reported that it has already undertaken analysis and processed voting result from e-Voting centres which raises a number of questions such as what sort of analysis has been undertaken and who has access to this data and how secure is the information?
The VEC assures us that it is secure but will not say what sort of reports and analysis have been undertaken. It is one thing to collect statistical information on e_voting system but it is another if the results of the e-voting have been analysed in the absence of public scrutiny and independent review.
It is wrong to ascertain the results of voting before the close of the polls on Saturday 6:00PM November 25, 2006. This sort of information is readily open to abuse and goes well beyond the sort of sampling you would expect from public opinion poll.
If the information is purely of a statistical nature (i.e.. No results or analysis of voting has been undertaken) then why has this statistical information not been made public.
Information on the number of people who have voted, the number of postal vote application and pre-poll voting should be readily available and published daily on the VEC web site. It's akin to holding an election and not knowing teh total number enrolled.
The main problem as we see it is that the processing of this information is undertaken in e-Space and, it would appear, not subject to proper public scrutiny.
Having asked questions as to the type of analysis and summary data produced the VEC have gone silent.
We have already expressed concern that postal voting application statistics are not readily available and are missing from the reports we have received. Lost in e-Space.
Much more review and analysis is required of our e-voting system before public confidence is assured. The Key to maintaining public confidence is the publication of all statistical data so as to ensure the conduct of elections is open and transparent and subject to proper scrutiny. Something that is missing when information is denied or not available. It is not good enough to just say "Trust us".
The VEC assures us that it is secure but will not say what sort of reports and analysis have been undertaken. It is one thing to collect statistical information on e_voting system but it is another if the results of the e-voting have been analysed in the absence of public scrutiny and independent review.
It is wrong to ascertain the results of voting before the close of the polls on Saturday 6:00PM November 25, 2006. This sort of information is readily open to abuse and goes well beyond the sort of sampling you would expect from public opinion poll.
If the information is purely of a statistical nature (i.e.. No results or analysis of voting has been undertaken) then why has this statistical information not been made public.
Information on the number of people who have voted, the number of postal vote application and pre-poll voting should be readily available and published daily on the VEC web site. It's akin to holding an election and not knowing teh total number enrolled.
The main problem as we see it is that the processing of this information is undertaken in e-Space and, it would appear, not subject to proper public scrutiny.
Having asked questions as to the type of analysis and summary data produced the VEC have gone silent.
We have already expressed concern that postal voting application statistics are not readily available and are missing from the reports we have received. Lost in e-Space.
Much more review and analysis is required of our e-voting system before public confidence is assured. The Key to maintaining public confidence is the publication of all statistical data so as to ensure the conduct of elections is open and transparent and subject to proper scrutiny. Something that is missing when information is denied or not available. It is not good enough to just say "Trust us".
Keeping you posted VEC Postal voting statistics still missing and unaccounted
APPLICATIONS FOR POSTAL VOTING CLOSED LAST NIGHT (THURSDAY) AND PRE-POLLING TONIGHT.
The table below is the latest information on postal votes provided by the VEC.
What's missing, again, is that the number of postal votes that have been issued.
We will keep you posted.
The table below is the latest information on postal votes provided by the VEC.
What's missing, again, is that the number of postal votes that have been issued.
Update: 3:00 PM
Having written to the VEC now on five occasions plus one phone call seeking an update on the final number of postal votes issued per district we are still left waiting.. Postal votes closed last Thursday and the number of postal ballots issued per district should have been readily available by now. Even under a manual system this information was available before the poll , under an computerised system and millions of dollars spent the VEC is either unable or unwilling to provide the number of postal ballots issued. WHY? If there is a disputed return this will become an issue in the courts. It is important that all ballot papers are properly accounted for. The provision of this information prior to the counting of the ballot is important. The last thing we want to see is a mysterious undisclosed bundle of 50 ballot papers arrive after the poll has closed.
Those wishing to obtain the missing data and statistics on the number of postal ballots that have been issued as opposed to the number returned should contact :
Glenda Frazer, Manager Election Services
T 03 9299 0590
F 03 9621 1204
M 0413 043 012
Glenda.Frazer@vec.vic.gov.au
--- end of update.
The VEC reports a vague figure of over 200,000 votes issued but for some unknown reason is unable to provide a detailed breakdown figure on each District. Which is surprising as you would have thought that all postal voting applications would have been checked off the electronic voters list before being sent out and as such statistics on the number of postal; votes should be readily available.
The VEC has spent millions of dollars on IT support and this important information cannot be reaily provided. I understand that postal returns are still being processed (even then they are electronically bar-coded) but the number of postal votes issued should have been available. We had requested that this information be provided daily but without success. This information should be on the VEC's web site as part of its committment to maintaining an open and transparent election system.
| State Election 2006 | ||
| 24-11-2006 21:32 | ||
| District | Early Votes | Postal Votes |
| Albert Park District | 3339 | 2175 |
| Altona District | 3527 | 1025 |
| Ballarat East District | 1997 | 1875 |
| Ballarat West District | 3952 | 1975 |
| Bass District | 2606 | 2649 |
| Bayswater District | 2108 | 2400 |
| Bellarine District | 3197 | 2351 |
| Benalla District | 3017 | 1575 |
| Benambra District | 4447 | 1800 |
| Bendigo East District | 3019 | 1875 |
| Bendigo West District | 2173 | 2049 |
| Bentleigh District | 1686 | 2475 |
| Box Hill District | 1606 | 2850 |
| Brighton District | 1850 | 2400 |
| Broadmeadows District | 1171 | 1075 |
| Brunswick District | 2022 | 1275 |
| Bulleen District | 2140 | 1977 |
| Bundoora District | 2347 | 1500 |
| Burwood District | 2038 | 2674 |
| Carrum District | 2675 | 1950 |
| Caulfield District | 4029 | 3975 |
| Clayton District | 1487 | 1375 |
| Cranbourne District | 1807 | 2325 |
| Dandenong District | 2170 | 1725 |
| Derrimut District | 3487 | 1051 |
| Doncaster District | 1810 | 2175 |
| Eltham District | 2796 | 2050 |
| Essendon District | 2866 | 1600 |
| Evelyn District | 2335 | 2325 |
| Ferntree Gully District | 2823 | 2250 |
| Footscray District | 3298 | 1401 |
| Forest Hill District | 1634 | 2150 |
| Frankston District | 2058 | 2201 |
| Geelong District | 2485 | 2326 |
| Gembrook District | 2055 | 2300 |
| Gippsland East District | 3472 | 1328 |
| Gippsland South District | 2238 | 1175 |
| Hastings District | 3384 | 2176 |
| Hawthorn District | 2300 | 2074 |
| Ivanhoe District | 2970 | 1825 |
| Keilor District | 2901 | 1351 |
| Kew District | 1571 | 1999 |
| Kilsyth District | 1936 | 2675 |
| Kororoit District | 3835 | 1200 |
| Lara District | 2106 | 1750 |
| Lowan District | 5135 | 1525 |
| Lyndhurst District | 1755 | 1775 |
| Macedon District | 6265 | 2099 |
| Malvern District | 2106 | 2200 |
| Melbourne District | 3069 | 1525 |
| Melton District | 4586 | 1125 |
| Mildura District | 4957 | 781 |
| Mill Park District | 1645 | 1175 |
| Mitcham District | 1883 | 2575 |
| Monbulk District | 1718 | 1950 |
| Mordialloc District | 1704 | 2200 |
| Mornington District | 3009 | 2025 |
| Morwell District | 4790 | 1275 |
| Mount Waverley District | 2506 | 2750 |
| Mulgrave District | 1668 | 1575 |
| Murray Valley District | 5958 | 800 |
| Narracan District | 4143 | 1974 |
| Narre Warren North District | 1900 | 2175 |
| Narre Warren South District | 2574 | 2950 |
| Nepean District | 4270 | 3350 |
| Niddrie District | 1781 | 1601 |
| Northcote District | 2650 | 1825 |
| Oakleigh District | 1423 | 2225 |
| Pascoe Vale District | 1514 | 1450 |
| Polwarth District | 1905 | 1850 |
| Prahran District | 2203 | 2025 |
| Preston District | 1534 | 1400 |
| Richmond District | 2433 | 1224 |
| Ripon District | 3219 | 1550 |
| Rodney District | 2532 | 1000 |
| Sandringham District | 1869 | 2425 |
| Scoresby District | 2260 | 2475 |
| Seymour District | 1872 | 2352 |
| Shepparton District | 3893 | 600 |
| South Barwon District | 2549 | 2499 |
| South-West Coast District | 7059 | 1600 |
| Swan Hill District | 2353 | 949 |
| Tarneit District | 3328 | 1450 |
| Thomastown District | 1317 | 1025 |
| Warrandyte District | 2222 | 2423 |
| Williamstown District | 1824 | 1449 |
| Yan Yean District | 2720 | 1976 |
| Yuroke District | 1951 | 1425 |
| 236822 | 165309 |
We will keep you posted.
Wednesday, November 22, 2006
Upper-House Analysis based on recent ACNielson and Morgan Polls
Election Night Update: Newspoll and ACNielson proves to be the most reliable polls published. The results of the election were more or less in line with their predictions with a last minute 1-2% swing to the Government on polling day. The Liberal Party in the upper-house suffered a 2% swing against them compared to the earlier polls two weeks out from the election.
The election was marred by Chief Commissioner Mr Tully who refused to provide statistical information on the number of postal votes issued (a document that is not confidential and in the past this information was readily avialable - see posts above) bringing both the VEC and the election into disrepute. Victorians and the new Parliamnet need to ask do we really need two public electoral offices duplicating what is essentially the same services at considerable cost to the state and the public purse. Judging by Mr Tully's performance the answer is no.
Election Day Update: 25/11/2006.
A election day Newspoll published today in the Australian Newspaper (See also the Herald Sun report published today) shows a last minute rebound to the ALP with voters opting to stick with the devil you know then to risk the new born. Greens are also peg back from the levels reported by Morgan Poll to just over 9%. This would bring into play our earlier analysis of upper-house results with the Greens only securing 2 upper-house seats. Today's poll is the one that really counts and we expect to call the results of the upper-house sometime before 9PM.
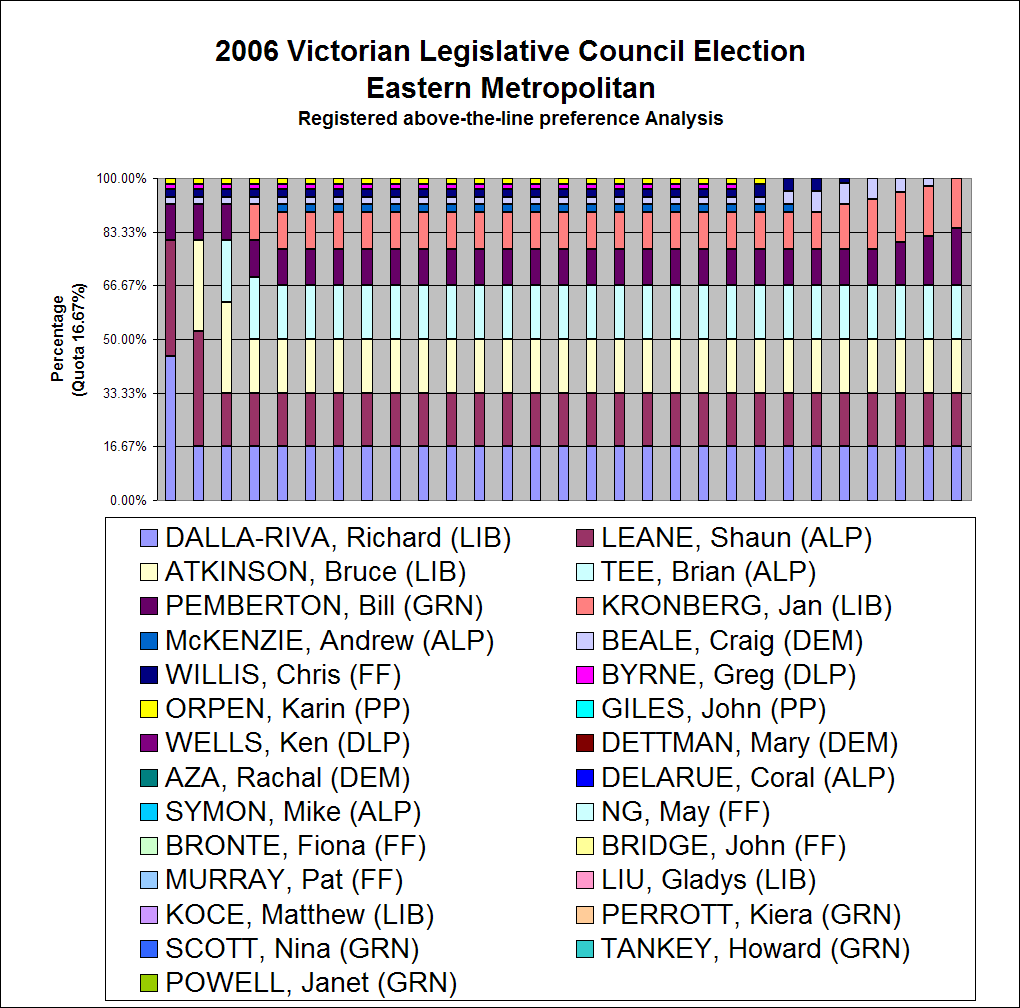
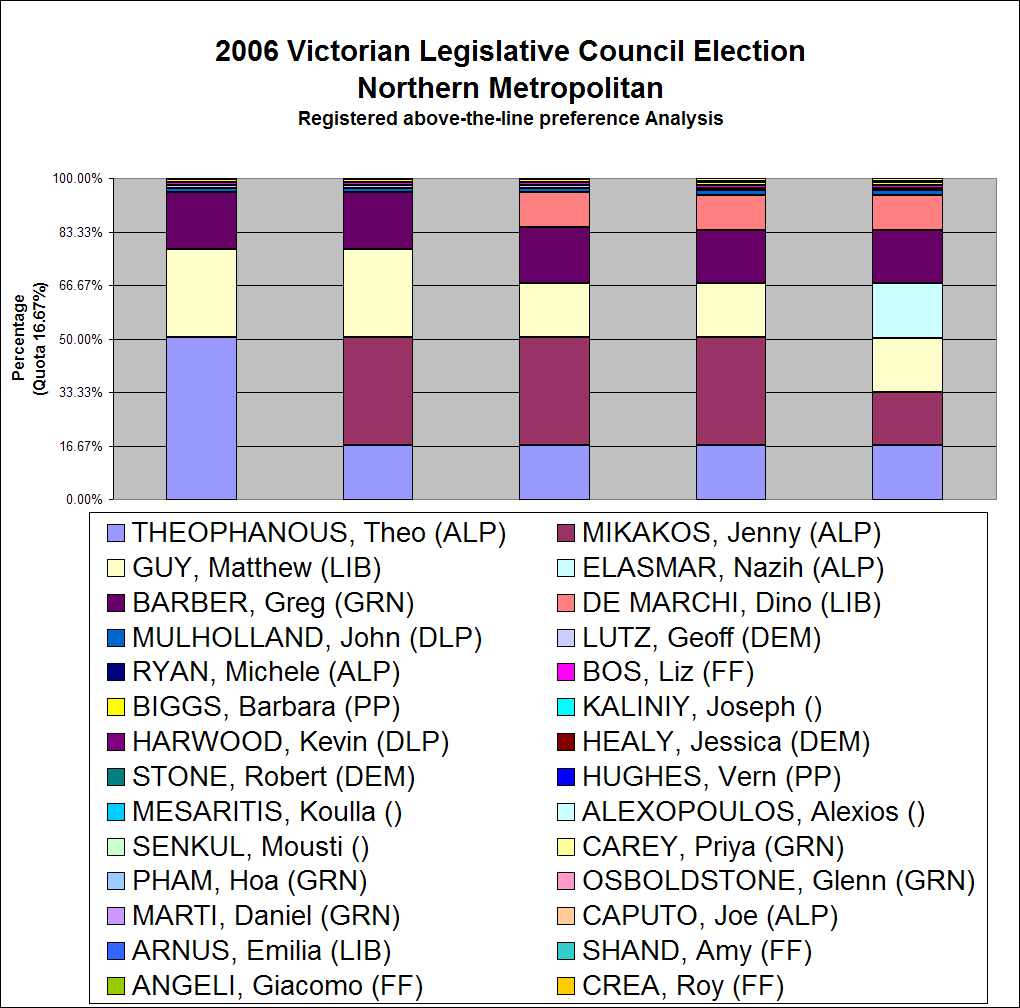
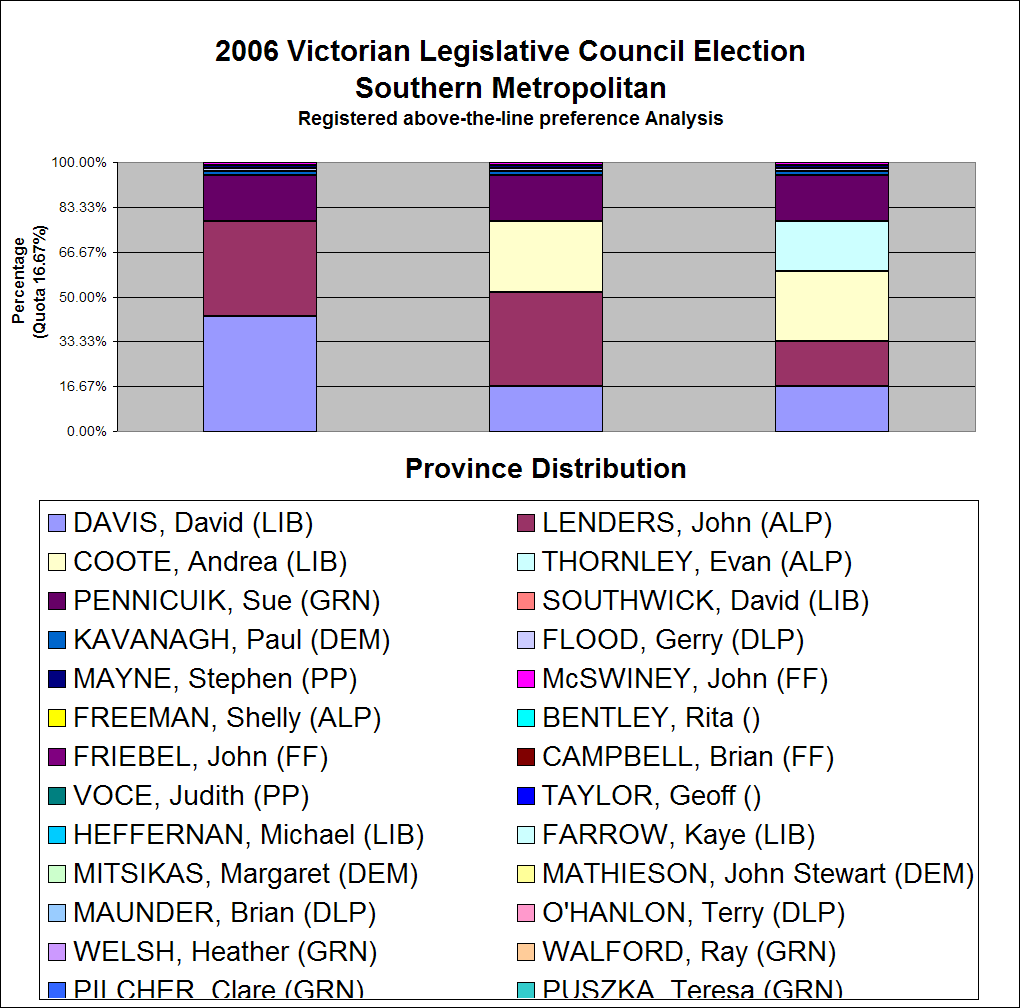
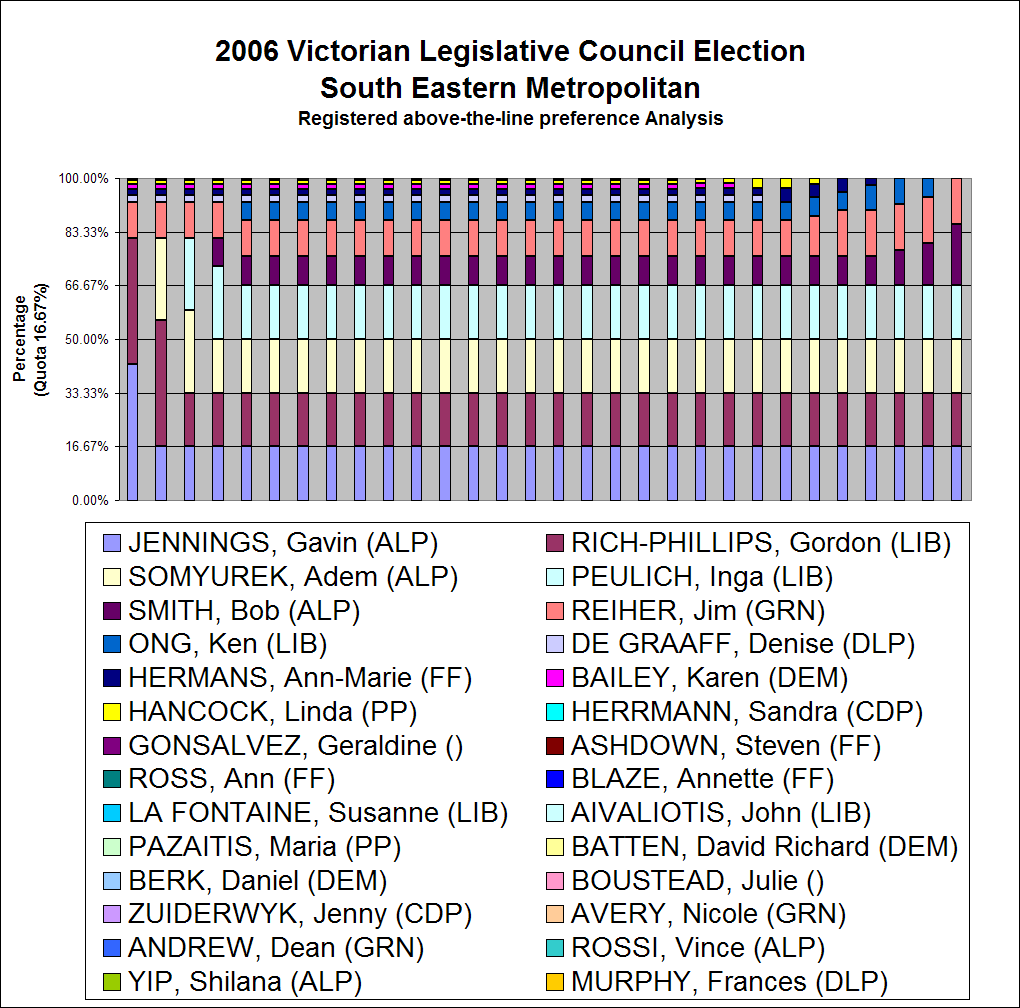
Below is a revised analysis of the Victorian upper-house results based on the notional distribution of party statewide votes as reported in the Morgan and ACNielson Polls published Tuesday/Monday.
The polls shows a statewide average vote for the ALP on 40.5%, the Liberal Party on 36%, National Party on 4%, Greens on 12%, and Others a total 7.5%. This is notional statewide data and is not based on any breakdown or detailed analysis of polling undertaken in each region. Unfortunately detailed breakdown data was not available. Information from internal party polling indicates a localised shift in the vote which is not accurately reflected in this analysis which is based solely on public information available at the time.
The recent polling has indicated an increase and consolidation of the Greens vote from 8% at two weeks earlier to 12% as of late last week with the Greens taking 2% from the Liberal Party. the consolidation of the vote between the main players has left a little room for other independents.
The election in Northern and Southern Metropolitan will most likely be decided on primary above-the-line votes and may not go to preferences.
The Western Victoria region is difficult to predict and the fifth seat could go to the DLP, Liberal or National Parties. In theory the DLP could win the fifth seat having stated from a low 2.5% primary vote. The success of the DLP in Western Victoria depends very much on the support of other minor parties and the surplus of the main players (ALP, Liberal, NP and the Greens) If the DLP is unsuccessful the DLP vote will most likely flow onto the National Party. This is a seat that will depend very much on the below the line preferences.
We will be monitoring and collating data on the upper-house on election night and hope to provide a revised estimate based on the primary vote and above-the-line returns.


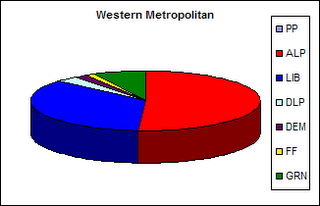


Vote Distribution Graphs


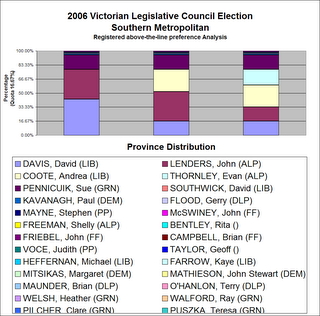

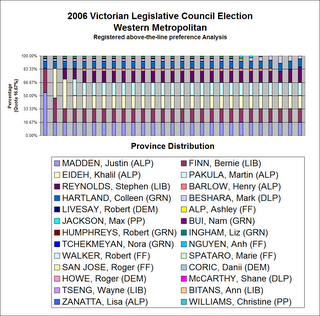


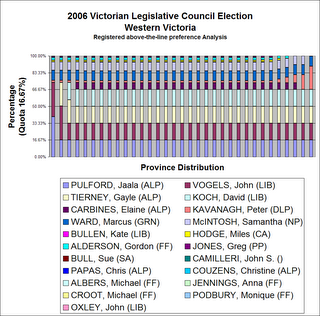
The election was marred by Chief Commissioner Mr Tully who refused to provide statistical information on the number of postal votes issued (a document that is not confidential and in the past this information was readily avialable - see posts above) bringing both the VEC and the election into disrepute. Victorians and the new Parliamnet need to ask do we really need two public electoral offices duplicating what is essentially the same services at considerable cost to the state and the public purse. Judging by Mr Tully's performance the answer is no.
Election Day Update: 25/11/2006.
A election day Newspoll published today in the Australian Newspaper (See also the Herald Sun report published today) shows a last minute rebound to the ALP with voters opting to stick with the devil you know then to risk the new born. Greens are also peg back from the levels reported by Morgan Poll to just over 9%. This would bring into play our earlier analysis of upper-house results with the Greens only securing 2 upper-house seats. Today's poll is the one that really counts and we expect to call the results of the upper-house sometime before 9PM.
Below is a revised analysis of the Victorian upper-house results based on the notional distribution of party statewide votes as reported in the Morgan and ACNielson Polls published Tuesday/Monday.
The polls shows a statewide average vote for the ALP on 40.5%, the Liberal Party on 36%, National Party on 4%, Greens on 12%, and Others a total 7.5%. This is notional statewide data and is not based on any breakdown or detailed analysis of polling undertaken in each region. Unfortunately detailed breakdown data was not available. Information from internal party polling indicates a localised shift in the vote which is not accurately reflected in this analysis which is based solely on public information available at the time.
The recent polling has indicated an increase and consolidation of the Greens vote from 8% at two weeks earlier to 12% as of late last week with the Greens taking 2% from the Liberal Party. the consolidation of the vote between the main players has left a little room for other independents.
The election in Northern and Southern Metropolitan will most likely be decided on primary above-the-line votes and may not go to preferences.
The Western Victoria region is difficult to predict and the fifth seat could go to the DLP, Liberal or National Parties. In theory the DLP could win the fifth seat having stated from a low 2.5% primary vote. The success of the DLP in Western Victoria depends very much on the support of other minor parties and the surplus of the main players (ALP, Liberal, NP and the Greens) If the DLP is unsuccessful the DLP vote will most likely flow onto the National Party. This is a seat that will depend very much on the below the line preferences.
We will be monitoring and collating data on the upper-house on election night and hope to provide a revised estimate based on the primary vote and above-the-line returns.
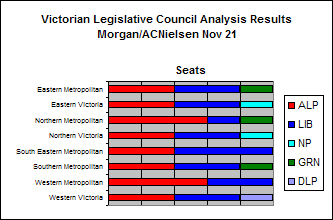
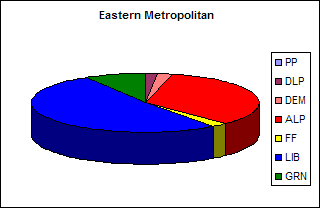
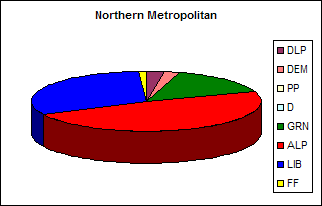

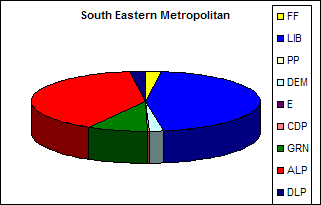
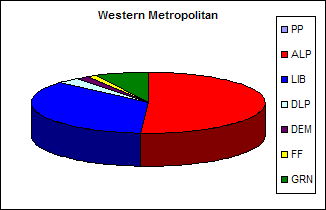

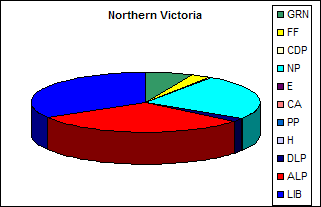

Vote Distribution Graphs


Tuesday, November 21, 2006
Melbourne's Mascot Lord Mayor John So what do you do?
Getting back to basics and the main purpose of this blog being the Melbourne City Council.
The Age today reports on the fact that Melbourne's mascot and most expensive Lord Mayor John So does little of the real work when it comes to earning his keep. John So receives a salary of $100,000.00 plus lurks and perks that double that amount.
Absent from all committee meetings, John So is not well informed and is more interested in seeking awards and self-grandeur then new policy development. In the meantime Melbourne City Council's committee structure is failing to provide real effective and professional input whilst local communities go unrepresented. The City Council which is too inward looking has not taken advantage of professional outside expert input.
In the absence of an effective Lord Mayor, Melbourne should open up its committee structure and appoint outside experts and community representatives to its advisory committees.
The current system of every councillor except the Lord Mayor doing all the work is not delivery good governance. The City Councillor's are being over worked and side-tracked from the real task of reviewing the Council's administration and policy development.
'Mascot mayor' under attack
Source: The Age - November 21, 2006
JOHN So might be our bro, and a favourite in the vote for World Mayor 2006 next month, but the popular Lord Mayor also appears to be bending Melbourne City Council's own rules by not attending the committee meetings where most of its work is done.
Cr Peter Clarke, who has branded Cr So a "mascot mayor", says he will campaign to force the Lord Mayor to attend meetings as part of his $110,000 annual salary.
"It is fine for John to turn up to the Myer Christmas window launch and sit next to Jennifer Hawkins — that's the ceremonial role he plays well," Cr Clarke said. "But he doesn't do anything else."
There is also disquiet among several other councillors, including from within Cr So's own team of supporters, about his unwillingness to attend committee meetings.
Cr Clarke last week lost a vote calling on the Lord Mayor to "honour" the council's "good governance charter".
Tonight he will call for another vote.
The charter requires the Lord Mayor to attend at least some of the council's seven committee meetings, instead of just the one council meeting each month.
"He attends no committee meetings," Cr Clarke said. "He needs to attend because he is paid to go."
Since being elected Lord Mayor in 2001, Cr So has seldom attended committee meetings, the main forum for residents and businesses to present matters to the council.
The public rarely presents matters at the monthly council meetings that the Lord Mayor attends. The council meeting is often little more than a rubber stamp for decisions made by committees.
Cr So's predecessors, Ivan Deveson and Peter Costigan, the only lord mayors since council amalgamations under the Kennett government, rarely missed committee meetings. Clover Moore, Lord Mayor of Sydney and also a member of the NSW State Parliament, attends every Sydney City Council committee meeting.
Cr So defended his non-appearance, saying he was elected as part of a team that included Deputy Lord Mayor Gary Singer, who attends all committee meetings.
"If Peter Clarke wants to make it an issue, he should have made it an issue at the 2004 election," Cr So said.
He said he dealt with all issues in private meetings with constituents before matters came before the council — something Cr Clarke said left the council open to corruption or nepotism.
The Lord Mayor rejected this. "It's not done behind closed doors," he said.
Cr So said he did not take offence at being called a "mascot" mayor. "People can call me all sorts of names, but the most important thing is that Melbourne is doing well."
The Age today reports on the fact that Melbourne's mascot and most expensive Lord Mayor John So does little of the real work when it comes to earning his keep. John So receives a salary of $100,000.00 plus lurks and perks that double that amount.
Absent from all committee meetings, John So is not well informed and is more interested in seeking awards and self-grandeur then new policy development. In the meantime Melbourne City Council's committee structure is failing to provide real effective and professional input whilst local communities go unrepresented. The City Council which is too inward looking has not taken advantage of professional outside expert input.
In the absence of an effective Lord Mayor, Melbourne should open up its committee structure and appoint outside experts and community representatives to its advisory committees.
The current system of every councillor except the Lord Mayor doing all the work is not delivery good governance. The City Councillor's are being over worked and side-tracked from the real task of reviewing the Council's administration and policy development.
'Mascot mayor' under attack
Source: The Age - November 21, 2006
JOHN So might be our bro, and a favourite in the vote for World Mayor 2006 next month, but the popular Lord Mayor also appears to be bending Melbourne City Council's own rules by not attending the committee meetings where most of its work is done.
Cr Peter Clarke, who has branded Cr So a "mascot mayor", says he will campaign to force the Lord Mayor to attend meetings as part of his $110,000 annual salary.
"It is fine for John to turn up to the Myer Christmas window launch and sit next to Jennifer Hawkins — that's the ceremonial role he plays well," Cr Clarke said. "But he doesn't do anything else."
There is also disquiet among several other councillors, including from within Cr So's own team of supporters, about his unwillingness to attend committee meetings.
Cr Clarke last week lost a vote calling on the Lord Mayor to "honour" the council's "good governance charter".
Tonight he will call for another vote.
The charter requires the Lord Mayor to attend at least some of the council's seven committee meetings, instead of just the one council meeting each month.
"He attends no committee meetings," Cr Clarke said. "He needs to attend because he is paid to go."
Since being elected Lord Mayor in 2001, Cr So has seldom attended committee meetings, the main forum for residents and businesses to present matters to the council.
The public rarely presents matters at the monthly council meetings that the Lord Mayor attends. The council meeting is often little more than a rubber stamp for decisions made by committees.
Cr So's predecessors, Ivan Deveson and Peter Costigan, the only lord mayors since council amalgamations under the Kennett government, rarely missed committee meetings. Clover Moore, Lord Mayor of Sydney and also a member of the NSW State Parliament, attends every Sydney City Council committee meeting.
Cr So defended his non-appearance, saying he was elected as part of a team that included Deputy Lord Mayor Gary Singer, who attends all committee meetings.
"If Peter Clarke wants to make it an issue, he should have made it an issue at the 2004 election," Cr So said.
He said he dealt with all issues in private meetings with constituents before matters came before the council — something Cr Clarke said left the council open to corruption or nepotism.
The Lord Mayor rejected this. "It's not done behind closed doors," he said.
Cr So said he did not take offence at being called a "mascot" mayor. "People can call me all sorts of names, but the most important thing is that Melbourne is doing well."
Monday, November 20, 2006
State Election Upper-house polling booth data will not be available on the night
In another surprise we have just been informed that the VEC will not be publishing upper-house results data for each of the polling booths. Instead they will only be publishing consolidated results for each of the eight electoral regions. Why we ask?
The Australian Electoral Commission provided on line tabulation of the Senate results showing above-the-line and first preference results for each polling place.
There is no reason why this information should not be made available via the Internet.
The preliminary polling booth data is important as it provides information that is used in the scrutiny of the ballot as means of knowing how many votes were recorded. This information is then used to ensure that all votes are accounted for and that the number of ballot papers received matches the number recorded at each polling station.
If it is required for the lower-house then the publication of the upper-house polling place vote tally should also be made available.
There is no excuse or reason why this information is not being published.
Already there are a number of concerns related to the computerisation of our elections. As more and more process are no longer undertaken manually there is a strong need to ensure that information is made readily available.
With the accessibility of the Internet this information can and must be published as part of the Victorian Governments and the Victorian electoral Commission's obligation to maintain an open and transparent elections system.
The Australian Electoral Commission provided on line tabulation of the Senate results showing above-the-line and first preference results for each polling place.
There is no reason why this information should not be made available via the Internet.
The preliminary polling booth data is important as it provides information that is used in the scrutiny of the ballot as means of knowing how many votes were recorded. This information is then used to ensure that all votes are accounted for and that the number of ballot papers received matches the number recorded at each polling station.
If it is required for the lower-house then the publication of the upper-house polling place vote tally should also be made available.
There is no excuse or reason why this information is not being published.
Already there are a number of concerns related to the computerisation of our elections. As more and more process are no longer undertaken manually there is a strong need to ensure that information is made readily available.
With the accessibility of the Internet this information can and must be published as part of the Victorian Governments and the Victorian electoral Commission's obligation to maintain an open and transparent elections system.
Election Statistics Missing data on Prepoll and Postal returns
Election Day update: Although we were told that this information was available the VEC and the Chief Commisioner Mr Tully refused to provide copies of this information,. This is not a confidential document and should have been made available on request. Mr Tully's conduct of the election, his refusal to ensure an open and transparent election and other issues has brought the VEC and himself into direpute (see above posts)
UPDATE: I have just received another email that corrects the misleading information previously forwarded.
"The VEC does store these stats for internal use, I have modified our report for you and it is attached up to mid afternoon today. The PVAs on this report are those applied for only and do not include the 41,700 GPVs who were mailed ballot material without application."
This is a relief as the previous advice (extract below) was worrying... I will endevaour to update the table below as soon as I can.
--- End update ---
In reply to a request for information on the number of postal and prepoll votes that had been issued and received back by the VEC we received the following reply:
Of concern is the fact that what's missing is the number of postal ballot papers that have been issued. We have been told that the VEC does not record this statistic by each district
If the above statement is true then this is of serious concern to us. The number of ballot papers issued and returned should be readily available on the VEC's web site. It is fundamental that elections are open and transparent . The internet provides an efficient and affordable means of making this information available to the public and candidates alike.
We have sort confirmation of the advice have we received (Which must be wrong). We hope to provide a updated running daily tally of the number of postal votes issued/received in the lead up to Saturdays election. We will keep you posted.
Early voting finishes at 6pm on Friday and the last day for accepting Postal Votes application is 6pm Thursday.
Below is a list of postal and pre-polling ballots papers that have been received and processed by the VEC as of 7:55 Sunday Night.
Update information provided on Postal Voting Applications - Missing Statistics on the 41,700 GPV Applications
Postal Voting Summary - CPC
State Election 2006
Batch Numbers:
1 - 18120
Print DateTime:
20-Nov-2006
03:47:24 PM
Vote Type
Number Processed
Albert Park District
2,710
Altona District
1,002
Ballarat East District
2,160
Ballarat West District
2,097
Bass District
2,999
Bayswater District
2,540
Bellarine District
Benalla District
1,804
Benambra District
2,169
Bendigo East District
1,972
Bendigo West District
2,223
Bentleigh District
2,705
Box Hill District
3,222
Brighton District
2,770
Broadmeadows District
870
Brunswick District
1,181
Bulleen District
2,323
Bundoora District
1,478
Burwood District
2,996
Carrum District
2,160
Caulfield District
3,380
Clayton District
1,340
Cranbourne District
2,541
Dandenong District
1,690
Derrimut District
714
Doncaster District
2,547
Eltham District
2,285
Essendon District
1,247
Evelyn District
2,649
Ferntree Gully District
2,490
Footscray District
1,182
Forest Hill District
2,451
Frankston District
2,392
Geelong District
2,245
Gembrook District
2,782
Gippsland East District
1,550
Gippsland South District
1,425
Hastings District
2,288
Hawthorn District
2,422
Ivanhoe District
1,815
Keilor District
Kew District
2,376
Kilsyth District
2,955
Kororoit District
922
Lara District
1,735
Lowan District
1,320
Lyndhurst District
1,883
Macedon District
2,448
Malvern District
2,485
Melbourne District
1,827
Melton District
1,233
Mildura District
856
Mill Park District
1,271
Mitcham District
2,975
Monbulk District
2,223
Mordialloc District
2,411
Mornington District
2,233
Morwell District
1,437
Mount Waverley District
3,140
Mulgrave District
1,702
Murray Valley District
878
Narracan District
2,294
Narre Warren North District
2,504
Narre Warren South District
3,281
Nepean District
3,149
Niddrie District
1,328
Northcote District
1,138
Oakleigh District
2,426
Pascoe Vale District
1,109
Polwarth District
1,657
Prahran District
2,346
Preston District
1,224
Richmond District
1,539
Ripon District
1,724
Rodney District
1,215
Sandringham District
2,869
Scoresby District
2,742
Seymour District
2,890
Shepparton District
616
South Barwon District
2,347
South-West Coast District
1,748
Swan Hill District
884
Tarneit District
1,531
Thomastown District
957
Warrandyte District
2,711
Williamstown District
1,761
Yan Yean District
2,366
Yuroke District
1,643
Totals - All Electorates
176,612
Accepted Applications Processed
Page 1 of 1
UPDATE: I have just received another email that corrects the misleading information previously forwarded.
"The VEC does store these stats for internal use, I have modified our report for you and it is attached up to mid afternoon today. The PVAs on this report are those applied for only and do not include the 41,700 GPVs who were mailed ballot material without application."
This is a relief as the previous advice (extract below) was worrying... I will endevaour to update the table below as soon as I can.
--- End update ---
In reply to a request for information on the number of postal and prepoll votes that had been issued and received back by the VEC we received the following reply:
"Attached is a copy of returned postal and early votes so far (as of last night) there are a few more postal declarations returned but we haven't processed all yet. I don't have a breakdown by District of the number of postal votes issued though over 200,000 had been mailed as of last week. "
Of concern is the fact that what's missing is the number of postal ballot papers that have been issued. We have been told that the VEC does not record this statistic by each district
"Sorry can't do, we don't process them by District as our system works on a whole of State roll we have no need to records numbers District by District."
If the above statement is true then this is of serious concern to us. The number of ballot papers issued and returned should be readily available on the VEC's web site. It is fundamental that elections are open and transparent . The internet provides an efficient and affordable means of making this information available to the public and candidates alike.
We have sort confirmation of the advice have we received (Which must be wrong). We hope to provide a updated running daily tally of the number of postal votes issued/received in the lead up to Saturdays election. We will keep you posted.
Early voting finishes at 6pm on Friday and the last day for accepting Postal Votes application is 6pm Thursday.
Below is a list of postal and pre-polling ballots papers that have been received and processed by the VEC as of 7:55 Sunday Night.
Dec Votes Breakdown by District | ||||
| State Election 2006 | ||||
| 19-11-2006 19:55 | ||||
| District | Early Votes | Absent Votes | Postal Votes | Total |
| Albert Park District | 904 | 0 | 375 | 1279 |
| Altona District | 854 | 0 | 200 | 1054 |
| Ballarat East District | 558 | 0 | 300 | 858 |
| Ballarat West District | 1171 | 0 | 600 | 1771 |
| Bass District | 658 | 0 | 400 | 1058 |
| Bayswater District | 615 | 0 | 525 | 1140 |
| Bellarine District | 867 | 0 | 475 | 1342 |
| Benalla District | 679 | 0 | 150 | 829 |
| Benambra District | 923 | 0 | 250 | 1173 |
| Bendigo East District | 705 | 0 | 350 | 1055 |
| Bendigo West District | 539 | 0 | 300 | 839 |
| Bentleigh District | 498 | 0 | 475 | 973 |
| Box Hill District | 574 | 0 | 450 | 1024 |
| Brighton District | 584 | 0 | 475 | 1059 |
| Broadmeadows District | 309 | 0 | 150 | 459 |
| Brunswick District | 572 | 0 | 175 | 747 |
| Bulleen District | 770 | 0 | 327 | 1097 |
| Bundoora District | 701 | 0 | 200 | 901 |
| Burwood District | 626 | 2 | 550 | 1178 |
| Carrum District | 737 | 0 | 275 | 1012 |
| Caulfield District | 1156 | 0 | 850 | 2006 |
| Clayton District | 515 | 0 | 200 | 715 |
| Cranbourne District | 538 | 1 | 525 | 1064 |
| Dandenong District | 653 | 0 | 300 | 953 |
| Derrimut District | 784 | 0 | 250 | 1034 |
| Doncaster District | 603 | 0 | 325 | 928 |
| Eltham District | 790 | 0 | 375 | 1165 |
| Essendon District | 842 | 0 | 275 | 1117 |
| Evelyn District | 636 | 0 | 400 | 1036 |
| Ferntree Gully District | 908 | 0 | 350 | 1258 |
| Footscray District | 829 | 0 | 275 | 1104 |
| Forest Hill District | 576 | 0 | 375 | 951 |
| Frankston District | 531 | 0 | 425 | 956 |
| Geelong District | 652 | 0 | 550 | 1202 |
| Gembrook District | 501 | 0 | 250 | 751 |
| Gippsland East District | 1058 | 0 | 50 | 1108 |
| Gippsland South District | 658 | 0 | 50 | 708 |
| Hastings District | 930 | 0 | 376 | 1306 |
| Hawthorn District | 704 | 0 | 275 | 979 |
| Ivanhoe District | 960 | 0 | 275 | 1235 |
| Keilor District | 720 | 0 | 275 | 995 |
| Kew District | 592 | 0 | 325 | 917 |
| Kilsyth District | 582 | 0 | 525 | 1107 |
| Kororoit District | 935 | 0 | 250 | 1185 |
| Lara District | 563 | 0 | 375 | 938 |
| Lowan District | 1256 | 0 | 75 | 1331 |
| Lyndhurst District | 526 | 0 | 250 | 776 |
| Macedon District | 1540 | 0 | 250 | 1790 |
| Malvern District | 682 | 0 | 250 | 932 |
| Melbourne District | 817 | 0 | 200 | 1017 |
| Melton District | 1182 | 0 | 150 | 1332 |
| Mildura District | 1400 | 0 | 0 | 1400 |
| Mill Park District | 499 | 0 | 200 | 699 |
| Mitcham District | 569 | 0 | 425 | 994 |
| Monbulk District | 408 | 0 | 225 | 633 |
| Mordialloc District | 468 | 0 | 325 | 793 |
| Mornington District | 813 | 0 | 300 | 1113 |
| Morwell District | 1180 | 0 | 225 | 1405 |
| Mount Waverley District | 702 | 0 | 350 | 1052 |
| Mulgrave District | 534 | 0 | 200 | 734 |
| Murray Valley District | 1266 | 0 | 50 | 1316 |
| Narracan District | 980 | 0 | 275 | 1255 |
| Narre Warren North District | 531 | 0 | 325 | 856 |
| Narre Warren South District | 695 | 0 | 475 | 1170 |
| Nepean District | 1291 | 0 | 750 | 2041 |
| Niddrie District | 511 | 0 | 351 | 862 |
| Northcote District | 704 | 0 | 300 | 1004 |
| Oakleigh District | 467 | 0 | 325 | 792 |
| Pascoe Vale District | 419 | 0 | 225 | 644 |
| Polwarth District | 446 | 0 | 100 | 546 |
| Prahran District | 590 | 0 | 150 | 740 |
| Preston District | 443 | 0 | 250 | 693 |
| Richmond District | 648 | 0 | 150 | 798 |
| Ripon District | 738 | 0 | 125 | 863 |
| Rodney District | 505 | 0 | 0 | 505 |
| Sandringham District | 628 | 0 | 450 | 1078 |
| Scoresby District | 721 | 0 | 350 | 1071 |
| Seymour District | 428 | 0 | 225 | 653 |
| Shepparton District | 862 | 0 | 75 | 937 |
| South Barwon District | 712 | 0 | 450 | 1162 |
| South-West Coast District | 1785 | 0 | 75 | 1860 |
| Swan Hill District | 441 | 0 | 0 | 441 |
| Tarneit District | 804 | 0 | 125 | 929 |
| Thomastown District | 284 | 0 | 150 | 434 |
| Warrandyte District | 621 | 0 | 375 | 996 |
| Williamstown District | 620 | 0 | 150 | 770 |
| Yan Yean District | 693 | 0 | 225 | 918 |
| Yuroke District | 486 | 0 | 125 | 611 |
| 63955 | 3 | 25554 | 89512 | |
Update information provided on Postal Voting Applications - Missing Statistics on the 41,700 GPV Applications
Postal Voting Summary - CPC
State Election 2006
Batch Numbers:
1 - 18120
Print DateTime:
20-Nov-2006
03:47:24 PM
Vote Type
Number Processed
Albert Park District
2,710
Altona District
1,002
Ballarat East District
2,160
Ballarat West District
2,097
Bass District
2,999
Bayswater District
2,540
Bellarine District
Benalla District
1,804
Benambra District
2,169
Bendigo East District
1,972
Bendigo West District
2,223
Bentleigh District
2,705
Box Hill District
3,222
Brighton District
2,770
Broadmeadows District
870
Brunswick District
1,181
Bulleen District
2,323
Bundoora District
1,478
Burwood District
2,996
Carrum District
2,160
Caulfield District
3,380
Clayton District
1,340
Cranbourne District
2,541
Dandenong District
1,690
Derrimut District
714
Doncaster District
2,547
Eltham District
2,285
Essendon District
1,247
Evelyn District
2,649
Ferntree Gully District
2,490
Footscray District
1,182
Forest Hill District
2,451
Frankston District
2,392
Geelong District
2,245
Gembrook District
2,782
Gippsland East District
1,550
Gippsland South District
1,425
Hastings District
2,288
Hawthorn District
2,422
Ivanhoe District
1,815
Keilor District
Kew District
2,376
Kilsyth District
2,955
Kororoit District
922
Lara District
1,735
Lowan District
1,320
Lyndhurst District
1,883
Macedon District
2,448
Malvern District
2,485
Melbourne District
1,827
Melton District
1,233
Mildura District
856
Mill Park District
1,271
Mitcham District
2,975
Monbulk District
2,223
Mordialloc District
2,411
Mornington District
2,233
Morwell District
1,437
Mount Waverley District
3,140
Mulgrave District
1,702
Murray Valley District
878
Narracan District
2,294
Narre Warren North District
2,504
Narre Warren South District
3,281
Nepean District
3,149
Niddrie District
1,328
Northcote District
1,138
Oakleigh District
2,426
Pascoe Vale District
1,109
Polwarth District
1,657
Prahran District
2,346
Preston District
1,224
Richmond District
1,539
Ripon District
1,724
Rodney District
1,215
Sandringham District
2,869
Scoresby District
2,742
Seymour District
2,890
Shepparton District
616
South Barwon District
2,347
South-West Coast District
1,748
Swan Hill District
884
Tarneit District
1,531
Thomastown District
957
Warrandyte District
2,711
Williamstown District
1,761
Yan Yean District
2,366
Yuroke District
1,643
Totals - All Electorates
176,612
Accepted Applications Processed
Page 1 of 1
Subscribe to:
Posts (Atom)