In another surprise we have just been informed that the VEC will not be publishing upper-house results data for each of the polling booths. Instead they will only be publishing consolidated results for each of the eight electoral regions. Why we ask?
The Australian Electoral Commission provided on line tabulation of the Senate results showing above-the-line and first preference results for each polling place.
There is no reason why this information should not be made available via the Internet.
The preliminary polling booth data is important as it provides information that is used in the scrutiny of the ballot as means of knowing how many votes were recorded. This information is then used to ensure that all votes are accounted for and that the number of ballot papers received matches the number recorded at each polling station.
If it is required for the lower-house then the publication of the upper-house polling place vote tally should also be made available.
There is no excuse or reason why this information is not being published.
Already there are a number of concerns related to the computerisation of our elections. As more and more process are no longer undertaken manually there is a strong need to ensure that information is made readily available.
With the accessibility of the Internet this information can and must be published as part of the Victorian Governments and the Victorian electoral Commission's obligation to maintain an open and transparent elections system.

Monday, November 20, 2006

Election Statistics Missing data on Prepoll and Postal returns
Election Day update: Although we were told that this information was available the VEC and the Chief Commisioner Mr Tully refused to provide copies of this information,. This is not a confidential document and should have been made available on request. Mr Tully's conduct of the election, his refusal to ensure an open and transparent election and other issues has brought the VEC and himself into direpute (see above posts)
UPDATE: I have just received another email that corrects the misleading information previously forwarded.
"The VEC does store these stats for internal use, I have modified our report for you and it is attached up to mid afternoon today. The PVAs on this report are those applied for only and do not include the 41,700 GPVs who were mailed ballot material without application."
This is a relief as the previous advice (extract below) was worrying... I will endevaour to update the table below as soon as I can.
--- End update ---
In reply to a request for information on the number of postal and prepoll votes that had been issued and received back by the VEC we received the following reply:
Of concern is the fact that what's missing is the number of postal ballot papers that have been issued. We have been told that the VEC does not record this statistic by each district
If the above statement is true then this is of serious concern to us. The number of ballot papers issued and returned should be readily available on the VEC's web site. It is fundamental that elections are open and transparent . The internet provides an efficient and affordable means of making this information available to the public and candidates alike.
We have sort confirmation of the advice have we received (Which must be wrong). We hope to provide a updated running daily tally of the number of postal votes issued/received in the lead up to Saturdays election. We will keep you posted.
Early voting finishes at 6pm on Friday and the last day for accepting Postal Votes application is 6pm Thursday.
Below is a list of postal and pre-polling ballots papers that have been received and processed by the VEC as of 7:55 Sunday Night.
Update information provided on Postal Voting Applications - Missing Statistics on the 41,700 GPV Applications
Postal Voting Summary - CPC
State Election 2006
Batch Numbers:
1 - 18120
Print DateTime:
20-Nov-2006
03:47:24 PM
Vote Type
Number Processed
Albert Park District
2,710
Altona District
1,002
Ballarat East District
2,160
Ballarat West District
2,097
Bass District
2,999
Bayswater District
2,540
Bellarine District
Benalla District
1,804
Benambra District
2,169
Bendigo East District
1,972
Bendigo West District
2,223
Bentleigh District
2,705
Box Hill District
3,222
Brighton District
2,770
Broadmeadows District
870
Brunswick District
1,181
Bulleen District
2,323
Bundoora District
1,478
Burwood District
2,996
Carrum District
2,160
Caulfield District
3,380
Clayton District
1,340
Cranbourne District
2,541
Dandenong District
1,690
Derrimut District
714
Doncaster District
2,547
Eltham District
2,285
Essendon District
1,247
Evelyn District
2,649
Ferntree Gully District
2,490
Footscray District
1,182
Forest Hill District
2,451
Frankston District
2,392
Geelong District
2,245
Gembrook District
2,782
Gippsland East District
1,550
Gippsland South District
1,425
Hastings District
2,288
Hawthorn District
2,422
Ivanhoe District
1,815
Keilor District
Kew District
2,376
Kilsyth District
2,955
Kororoit District
922
Lara District
1,735
Lowan District
1,320
Lyndhurst District
1,883
Macedon District
2,448
Malvern District
2,485
Melbourne District
1,827
Melton District
1,233
Mildura District
856
Mill Park District
1,271
Mitcham District
2,975
Monbulk District
2,223
Mordialloc District
2,411
Mornington District
2,233
Morwell District
1,437
Mount Waverley District
3,140
Mulgrave District
1,702
Murray Valley District
878
Narracan District
2,294
Narre Warren North District
2,504
Narre Warren South District
3,281
Nepean District
3,149
Niddrie District
1,328
Northcote District
1,138
Oakleigh District
2,426
Pascoe Vale District
1,109
Polwarth District
1,657
Prahran District
2,346
Preston District
1,224
Richmond District
1,539
Ripon District
1,724
Rodney District
1,215
Sandringham District
2,869
Scoresby District
2,742
Seymour District
2,890
Shepparton District
616
South Barwon District
2,347
South-West Coast District
1,748
Swan Hill District
884
Tarneit District
1,531
Thomastown District
957
Warrandyte District
2,711
Williamstown District
1,761
Yan Yean District
2,366
Yuroke District
1,643
Totals - All Electorates
176,612
Accepted Applications Processed
Page 1 of 1
UPDATE: I have just received another email that corrects the misleading information previously forwarded.
"The VEC does store these stats for internal use, I have modified our report for you and it is attached up to mid afternoon today. The PVAs on this report are those applied for only and do not include the 41,700 GPVs who were mailed ballot material without application."
This is a relief as the previous advice (extract below) was worrying... I will endevaour to update the table below as soon as I can.
--- End update ---
In reply to a request for information on the number of postal and prepoll votes that had been issued and received back by the VEC we received the following reply:
"Attached is a copy of returned postal and early votes so far (as of last night) there are a few more postal declarations returned but we haven't processed all yet. I don't have a breakdown by District of the number of postal votes issued though over 200,000 had been mailed as of last week. "
Of concern is the fact that what's missing is the number of postal ballot papers that have been issued. We have been told that the VEC does not record this statistic by each district
"Sorry can't do, we don't process them by District as our system works on a whole of State roll we have no need to records numbers District by District."
If the above statement is true then this is of serious concern to us. The number of ballot papers issued and returned should be readily available on the VEC's web site. It is fundamental that elections are open and transparent . The internet provides an efficient and affordable means of making this information available to the public and candidates alike.
We have sort confirmation of the advice have we received (Which must be wrong). We hope to provide a updated running daily tally of the number of postal votes issued/received in the lead up to Saturdays election. We will keep you posted.
Early voting finishes at 6pm on Friday and the last day for accepting Postal Votes application is 6pm Thursday.
Below is a list of postal and pre-polling ballots papers that have been received and processed by the VEC as of 7:55 Sunday Night.
Dec Votes Breakdown by District | ||||
| State Election 2006 | ||||
| 19-11-2006 19:55 | ||||
| District | Early Votes | Absent Votes | Postal Votes | Total |
| Albert Park District | 904 | 0 | 375 | 1279 |
| Altona District | 854 | 0 | 200 | 1054 |
| Ballarat East District | 558 | 0 | 300 | 858 |
| Ballarat West District | 1171 | 0 | 600 | 1771 |
| Bass District | 658 | 0 | 400 | 1058 |
| Bayswater District | 615 | 0 | 525 | 1140 |
| Bellarine District | 867 | 0 | 475 | 1342 |
| Benalla District | 679 | 0 | 150 | 829 |
| Benambra District | 923 | 0 | 250 | 1173 |
| Bendigo East District | 705 | 0 | 350 | 1055 |
| Bendigo West District | 539 | 0 | 300 | 839 |
| Bentleigh District | 498 | 0 | 475 | 973 |
| Box Hill District | 574 | 0 | 450 | 1024 |
| Brighton District | 584 | 0 | 475 | 1059 |
| Broadmeadows District | 309 | 0 | 150 | 459 |
| Brunswick District | 572 | 0 | 175 | 747 |
| Bulleen District | 770 | 0 | 327 | 1097 |
| Bundoora District | 701 | 0 | 200 | 901 |
| Burwood District | 626 | 2 | 550 | 1178 |
| Carrum District | 737 | 0 | 275 | 1012 |
| Caulfield District | 1156 | 0 | 850 | 2006 |
| Clayton District | 515 | 0 | 200 | 715 |
| Cranbourne District | 538 | 1 | 525 | 1064 |
| Dandenong District | 653 | 0 | 300 | 953 |
| Derrimut District | 784 | 0 | 250 | 1034 |
| Doncaster District | 603 | 0 | 325 | 928 |
| Eltham District | 790 | 0 | 375 | 1165 |
| Essendon District | 842 | 0 | 275 | 1117 |
| Evelyn District | 636 | 0 | 400 | 1036 |
| Ferntree Gully District | 908 | 0 | 350 | 1258 |
| Footscray District | 829 | 0 | 275 | 1104 |
| Forest Hill District | 576 | 0 | 375 | 951 |
| Frankston District | 531 | 0 | 425 | 956 |
| Geelong District | 652 | 0 | 550 | 1202 |
| Gembrook District | 501 | 0 | 250 | 751 |
| Gippsland East District | 1058 | 0 | 50 | 1108 |
| Gippsland South District | 658 | 0 | 50 | 708 |
| Hastings District | 930 | 0 | 376 | 1306 |
| Hawthorn District | 704 | 0 | 275 | 979 |
| Ivanhoe District | 960 | 0 | 275 | 1235 |
| Keilor District | 720 | 0 | 275 | 995 |
| Kew District | 592 | 0 | 325 | 917 |
| Kilsyth District | 582 | 0 | 525 | 1107 |
| Kororoit District | 935 | 0 | 250 | 1185 |
| Lara District | 563 | 0 | 375 | 938 |
| Lowan District | 1256 | 0 | 75 | 1331 |
| Lyndhurst District | 526 | 0 | 250 | 776 |
| Macedon District | 1540 | 0 | 250 | 1790 |
| Malvern District | 682 | 0 | 250 | 932 |
| Melbourne District | 817 | 0 | 200 | 1017 |
| Melton District | 1182 | 0 | 150 | 1332 |
| Mildura District | 1400 | 0 | 0 | 1400 |
| Mill Park District | 499 | 0 | 200 | 699 |
| Mitcham District | 569 | 0 | 425 | 994 |
| Monbulk District | 408 | 0 | 225 | 633 |
| Mordialloc District | 468 | 0 | 325 | 793 |
| Mornington District | 813 | 0 | 300 | 1113 |
| Morwell District | 1180 | 0 | 225 | 1405 |
| Mount Waverley District | 702 | 0 | 350 | 1052 |
| Mulgrave District | 534 | 0 | 200 | 734 |
| Murray Valley District | 1266 | 0 | 50 | 1316 |
| Narracan District | 980 | 0 | 275 | 1255 |
| Narre Warren North District | 531 | 0 | 325 | 856 |
| Narre Warren South District | 695 | 0 | 475 | 1170 |
| Nepean District | 1291 | 0 | 750 | 2041 |
| Niddrie District | 511 | 0 | 351 | 862 |
| Northcote District | 704 | 0 | 300 | 1004 |
| Oakleigh District | 467 | 0 | 325 | 792 |
| Pascoe Vale District | 419 | 0 | 225 | 644 |
| Polwarth District | 446 | 0 | 100 | 546 |
| Prahran District | 590 | 0 | 150 | 740 |
| Preston District | 443 | 0 | 250 | 693 |
| Richmond District | 648 | 0 | 150 | 798 |
| Ripon District | 738 | 0 | 125 | 863 |
| Rodney District | 505 | 0 | 0 | 505 |
| Sandringham District | 628 | 0 | 450 | 1078 |
| Scoresby District | 721 | 0 | 350 | 1071 |
| Seymour District | 428 | 0 | 225 | 653 |
| Shepparton District | 862 | 0 | 75 | 937 |
| South Barwon District | 712 | 0 | 450 | 1162 |
| South-West Coast District | 1785 | 0 | 75 | 1860 |
| Swan Hill District | 441 | 0 | 0 | 441 |
| Tarneit District | 804 | 0 | 125 | 929 |
| Thomastown District | 284 | 0 | 150 | 434 |
| Warrandyte District | 621 | 0 | 375 | 996 |
| Williamstown District | 620 | 0 | 150 | 770 |
| Yan Yean District | 693 | 0 | 225 | 918 |
| Yuroke District | 486 | 0 | 125 | 611 |
| 63955 | 3 | 25554 | 89512 | |
Update information provided on Postal Voting Applications - Missing Statistics on the 41,700 GPV Applications
Postal Voting Summary - CPC
State Election 2006
Batch Numbers:
1 - 18120
Print DateTime:
20-Nov-2006
03:47:24 PM
Vote Type
Number Processed
Albert Park District
2,710
Altona District
1,002
Ballarat East District
2,160
Ballarat West District
2,097
Bass District
2,999
Bayswater District
2,540
Bellarine District
Benalla District
1,804
Benambra District
2,169
Bendigo East District
1,972
Bendigo West District
2,223
Bentleigh District
2,705
Box Hill District
3,222
Brighton District
2,770
Broadmeadows District
870
Brunswick District
1,181
Bulleen District
2,323
Bundoora District
1,478
Burwood District
2,996
Carrum District
2,160
Caulfield District
3,380
Clayton District
1,340
Cranbourne District
2,541
Dandenong District
1,690
Derrimut District
714
Doncaster District
2,547
Eltham District
2,285
Essendon District
1,247
Evelyn District
2,649
Ferntree Gully District
2,490
Footscray District
1,182
Forest Hill District
2,451
Frankston District
2,392
Geelong District
2,245
Gembrook District
2,782
Gippsland East District
1,550
Gippsland South District
1,425
Hastings District
2,288
Hawthorn District
2,422
Ivanhoe District
1,815
Keilor District
Kew District
2,376
Kilsyth District
2,955
Kororoit District
922
Lara District
1,735
Lowan District
1,320
Lyndhurst District
1,883
Macedon District
2,448
Malvern District
2,485
Melbourne District
1,827
Melton District
1,233
Mildura District
856
Mill Park District
1,271
Mitcham District
2,975
Monbulk District
2,223
Mordialloc District
2,411
Mornington District
2,233
Morwell District
1,437
Mount Waverley District
3,140
Mulgrave District
1,702
Murray Valley District
878
Narracan District
2,294
Narre Warren North District
2,504
Narre Warren South District
3,281
Nepean District
3,149
Niddrie District
1,328
Northcote District
1,138
Oakleigh District
2,426
Pascoe Vale District
1,109
Polwarth District
1,657
Prahran District
2,346
Preston District
1,224
Richmond District
1,539
Ripon District
1,724
Rodney District
1,215
Sandringham District
2,869
Scoresby District
2,742
Seymour District
2,890
Shepparton District
616
South Barwon District
2,347
South-West Coast District
1,748
Swan Hill District
884
Tarneit District
1,531
Thomastown District
957
Warrandyte District
2,711
Williamstown District
1,761
Yan Yean District
2,366
Yuroke District
1,643
Totals - All Electorates
176,612
Accepted Applications Processed
Page 1 of 1
Victorian Legislative Council Analysis Summary November State Election review
Update November 22, 2006
We have published a revised Upper-House Analysis based on latest polls published recently.
This poll shows the Greens winning three seats (Although I under stand Stephen Mayne claims People Power is in for a chance in Eastern Metropolitan. Much of People Powers chances rely on the extent of their campaign and good preferences and a lot of luck. In analysing the possible results we had People Power also in with a chance in Western Metropolitan but feed back on the ground is that people power are not effectively campaigning in the West. Their main hope is if their HTV cards high-lites the single issue 'Pokies" which is what they have boiled down to. Strangely enough the issue of "Pokies" effects the Western Suburbs the most but People Power are not at the fore-front or active in the West.
Game on. :)
Update: November 19, 2006
Two more polls published today
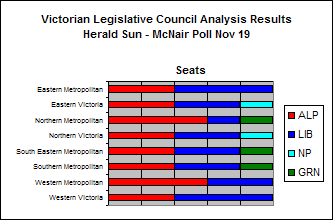
Herald Sun McNair Gallop Poll(November 19, 2006)
If the Herald-sun McNair poll (published today) is true and the reversal of ALP fortunes as indicated is replicated in the Upper-house then the Liberal Party/National Party (46%) would pick up from the ALP (39%) in both Western Metropolitan and Western Victoria regions putting an end to the DLP's pipe dream. The Greens (9%) also have a chance at a third seat in South Eastern Metropolitan.
Such a reversal in fortunes is difficult to see, but then it is a third term election and punters are under the belief that Labor is a shoe in..
This would leave the ALP with 18, Liberal Party with 17, Greens with 3 and NP 2.

Projected total seat allocation:
ALP: 21 (-2) * Western Metropolitan and Western Victoria
LIB: 15 (+1) * Western Metropolitan
NP: 2 (+1) * Western Victoria
GRN: 2
Newspoll (November 11, 2006)
Major party vote allocation is based on the Newspoll data published in the Australian Newspaper on November 11, 2006. Newspoll showed the ALP on 44%, Liberal/National Party on 40% and the Australian Greens on 8%. (See below for projected results summary)
Polling data request
Again this analysis is based on Newpoll information published in the Australian Newspaper (nov 11). It is not based on any detailed polling results broken down into upperhouse seats. If any of the major polling players (Newspoll, Morgan, Gallop Poll, Galaxy Poll) are interested in making a name for themselves then please brakdown you polling into the new upper-house seats, then we should be able to determine with greater accuracy the likely results.
A couple of the seats are showing up to be a possible a close race for the fifth spot. More work and refinement of the data in these seats will be undertaken as the election draws nearer and better information becomes available.
Electorate profiling
Electorate profiling and party vote distribution is calculated using the 2004 Victorian Senate results. Senate data is used to determine the major party state-wide vote ratio to each electorate and the Senate results are also as a guide for allocating minor party preferences. Thenbest thing about the Senate statistics is that it is a full dataset and it uses the same above-the-line voting system.
Vote distribution
Votes have been distributed according to the registered above-the-line preferences allocations made by each of the major parties. As most people will vote above-the-line a majority (90% or more) of the votes will be distributed as allocated. Most below the line votes either follow to a large part the party's recommendations or with minor variation. As most of the below the line has no focus they tend to cancel out each other and as such there is no attempt to ascertain the impact of below-the-line-votes other then to say where the results of the election of the fifth position is close then of course closer scrutiny will be undertaken on the night.
Another issue that will only became apparent after preliminary results are known is the distortion built-in to the system that can effect the results of election if it is very close. In calculating our analysis results we have used the "imperfect bias" that exists in the VEC's adopted system (See Voting Analysis labels)
Other issues
There are a few unknowns - the things we should have known but did not know and what we know now is that we did not know. :) such as unknown parties/groups that could effect the result in rural Victoria in particular. (See below for additional comments)
Resources
We have used the following resources and information which we have found valuable in our research.
The Pollbludger
Antony Green -ABC
Friends and contacts on the ground whose assessments I value greatly and
Past experience over 25 years) in analysing state elections and the Victorian upper-house in particular - special thanks to Robert Ray, John Lenders, Henk van Leewen and Evan Walker who over the years had taught me a lot about how to look at the results as they came in. Robert Ray was a person who could call the results quicker then anyone I have known.
ELECTORATE ANALYSIS SUMMARY
Metropolitan Seats
Eastern Metropolitan
Districts: Bayswater, Box Hill, Bulleen, Doncaster, Eltham, Ferntree Gully, Forest Hill, Kilsyth, Mitcham, Scoresby and Warrandyte
So it is a contest between the Liberals and the Greens as to who can top the threshold first. The Greens need to start working on pegging back the Liberal Party or they will once again become the wasted quota. The odds are in the Greens favour (70/30) to win the seat.
Districts: Ballarat East, Ballarat West, Bellarine, Geelong, Lara, Lowan, Melton, Polwarth, Ripon, South Barwon and South-West Coast
 The fight for the last seat is extremely close (which means I have to spend time homing in my analysis) with a fight to the death between the ALP and National Party. Again the results of this Analysis is based on a Liberal/National Party split of 85% Lib 15% NP.
Unlike other analysis out there I have not doubled Family First's vote and expect they will get close to what they obtained in the Senate where there was suplus percentages we increased Family First marginally. Also it is unlikely that the DLP will secure more votes then they obtained during the 2004 senate. In therory it is possib;e that if Family First can gain around 4% of the vote then the DLP could leap-frog out to win the seat but as stated I do not believe Family First will double their vote. There is more chance of the Catholics , the Protestants uniting before Family First attract wide support.

I will try and find time and update my analysis when ready. I have published the graph below for completeness of information but readers should take it with a note of caution.
We have published a revised Upper-House Analysis based on latest polls published recently.
This poll shows the Greens winning three seats (Although I under stand Stephen Mayne claims People Power is in for a chance in Eastern Metropolitan. Much of People Powers chances rely on the extent of their campaign and good preferences and a lot of luck. In analysing the possible results we had People Power also in with a chance in Western Metropolitan but feed back on the ground is that people power are not effectively campaigning in the West. Their main hope is if their HTV cards high-lites the single issue 'Pokies" which is what they have boiled down to. Strangely enough the issue of "Pokies" effects the Western Suburbs the most but People Power are not at the fore-front or active in the West.
Game on. :)
Update: November 19, 2006
Two more polls published today
Herald Sun McNair Gallop Poll(November 19, 2006)
If the Herald-sun McNair poll (published today) is true and the reversal of ALP fortunes as indicated is replicated in the Upper-house then the Liberal Party/National Party (46%) would pick up from the ALP (39%) in both Western Metropolitan and Western Victoria regions putting an end to the DLP's pipe dream. The Greens (9%) also have a chance at a third seat in South Eastern Metropolitan.
Such a reversal in fortunes is difficult to see, but then it is a third term election and punters are under the belief that Labor is a shoe in..
This would leave the ALP with 18, Liberal Party with 17, Greens with 3 and NP 2.
Morgan Poll
In complete reversal to the McNair Poll, the Morgan Poll (published Nov 20) of 778 voters commisisoned by Channel Nine shows a consldidation of voting for the main players but with Labor (43%) maintaining an overall lead, Liberal/National Party (38%). This is a drop of 2% for the the Liberal (34%)/National Party(4%) from last weeks Newspoll with the National Party being the main loser . The Greens (13%) showed an increased consolidation at the expense of other minor parties.
Analysis of this poll, applied to the upperhouse, produces the same results of last weeks poll -no change other then increasing the likely hood of the ALP winning in Western Victoria and Western Metropolitan. The Greens are still below quota in the South Eastern Region and thanks to unfavourable Liberal Party preferences fail to win a set in this Region. (However this poll indicates trouble for Labor in the lowerhouse seats of Melbourne and Richmond following the decision of the Liberal Party last Friday to prefernce the Greens ahead of Labor in inner City held seats.)

Projected total seat allocation:
ALP: 21 (-2) * Western Metropolitan and Western Victoria
LIB: 15 (+1) * Western Metropolitan
NP: 2 (+1) * Western Victoria
GRN: 2
Newspoll (November 11, 2006)
Major party vote allocation is based on the Newspoll data published in the Australian Newspaper on November 11, 2006. Newspoll showed the ALP on 44%, Liberal/National Party on 40% and the Australian Greens on 8%. (See below for projected results summary)
Polling data request
Again this analysis is based on Newpoll information published in the Australian Newspaper (nov 11). It is not based on any detailed polling results broken down into upperhouse seats. If any of the major polling players (Newspoll, Morgan, Gallop Poll, Galaxy Poll) are interested in making a name for themselves then please brakdown you polling into the new upper-house seats, then we should be able to determine with greater accuracy the likely results.
A couple of the seats are showing up to be a possible a close race for the fifth spot. More work and refinement of the data in these seats will be undertaken as the election draws nearer and better information becomes available.
Electorate profiling
Electorate profiling and party vote distribution is calculated using the 2004 Victorian Senate results. Senate data is used to determine the major party state-wide vote ratio to each electorate and the Senate results are also as a guide for allocating minor party preferences. Thenbest thing about the Senate statistics is that it is a full dataset and it uses the same above-the-line voting system.
Vote distribution
Votes have been distributed according to the registered above-the-line preferences allocations made by each of the major parties. As most people will vote above-the-line a majority (90% or more) of the votes will be distributed as allocated. Most below the line votes either follow to a large part the party's recommendations or with minor variation. As most of the below the line has no focus they tend to cancel out each other and as such there is no attempt to ascertain the impact of below-the-line-votes other then to say where the results of the election of the fifth position is close then of course closer scrutiny will be undertaken on the night.
Another issue that will only became apparent after preliminary results are known is the distortion built-in to the system that can effect the results of election if it is very close. In calculating our analysis results we have used the "imperfect bias" that exists in the VEC's adopted system (See Voting Analysis labels)
Other issues
There are a few unknowns - the things we should have known but did not know and what we know now is that we did not know. :) such as unknown parties/groups that could effect the result in rural Victoria in particular. (See below for additional comments)
Resources
We have used the following resources and information which we have found valuable in our research.
The Pollbludger
A good site for insightful information and discussion on electionsThe Speaker at Upperhouse.info
Great quick and easy to use calculator which I used to verify the results of my database. (I am not sure if the speaker uses the same inbuilt bias as the VEC in calculating the surplus and integer based and segmentation used in distributing preferences of candidates that are eliminated or if he has opted for the more accurate and preferred value based distribution keeping all remainders with the candidates (This is not as big an issue on undertaking the current analysis but is an issue when tabulating the detailed results cast on the night. This issue must be debated sooner rather then later
Antony Green -ABC
A resource of information that can not be matched. Its good to talk to someone that understands the functions and mechanics of elections. I think he knows more about the conduct of elections then the VEC which is great.The Victorian Electoral Commission (VEC)
I will withhold most of my comments about the VEC for the time being, other then to say that they are slowly improving since they changed hands at the top. The VEC needs to stop pretending that elections are esoteric and state opening up and becoming more transparent.Newspapers and published polls
With the introduction of computers and electronic counting of elections there is the potential for elections to become more transparent and open, but at the same time there are serious risks of the opposite occurring as information that was previously subjected to public scrutiny is now hidden away in data exising in cyberspace. It is up to the VEC and the AEC to ensure that public access to this information is readily
available. My thanks to Glenda who has been most helpful to date.
Herald-sun
The Age
The Australian
Friends and contacts on the ground whose assessments I value greatly and
Past experience over 25 years) in analysing state elections and the Victorian upper-house in particular - special thanks to Robert Ray, John Lenders, Henk van Leewen and Evan Walker who over the years had taught me a lot about how to look at the results as they came in. Robert Ray was a person who could call the results quicker then anyone I have known.
ELECTORATE ANALYSIS SUMMARY
Metropolitan Seats
Eastern Metropolitan
Districts: Bayswater, Box Hill, Bulleen, Doncaster, Eltham, Ferntree Gully, Forest Hill, Kilsyth, Mitcham, Scoresby and Warrandyte
Eastern Metropolitan is a close race for the last position with a contest between the Liberals (17.58%) and the Greens (15.75%)
The graphs displayed below shows the projected vote allocation and preference distribution based on estimated statewide preferences by Newspoll as reported in the Australian Newspaper November 11 with a statewide vote for the ALP (44%), Lib/Nat (40%) and the Greens (8%). Projected into the Eastern Metropolitan seat this translates into a primary vote of Labor(38.41%), Liberal (45.69%) and the Greens (7.45%) Again the Greens fall below that 8.5% needed to have a chance of winning the seat.
The Greens need to pick up that extra one percentage points but it can not come from the ALP whose surplus is too small at the end of the count. Family First, who have placed the Greens last, top up the Liberal vote which sees them over the line
It's close but the Liberal Party have the edge and this seat whilst within reach is not going to go to the Greens just yet.

Projected seat allocation:
ALP 2
Lib 3
Northern Metropolitan
Districts: Broadmeadows, Brunswick, Bundoora, Ivanhoe, Melbourne, Mill Park, Northcote, Preston, Richmond, Thomastown and Yan Yean
 As with the 2004 senate vote all depends on the thresholds. The Greens need to poll 8.5% to win a seat and the Liberal Party needs to be below 29% Based on electorate profile using the recent Newspol statewide party percentages its looks like a close race.
Newspoll put the Greens at 8% statewide which translates into around 12.5% for the Northern Metropolitan seat.
The Liberal Party is listed at a statewide 40% (27-29% and rising in the Northern Metropolitan electorate). Its a fine balance, if the Liberal vote increases then the Greens chances of winning the seat go down.
The ALP has around 51% of the seats primary vote above 3 quotas. of 50. Even if the ALP fall below the 50% threshold they will still have more votes then the Liberal Party who will push the ALP over the line for the 3rd spot.So it is a contest between the Liberals and the Greens as to who can top the threshold first. The Greens need to start working on pegging back the Liberal Party or they will once again become the wasted quota. The odds are in the Greens favour (70/30) to win the seat.

Shift needed to change the result
ALP 51.0%
LIBERAL 30.0% (Currently on around 28%)
GREENS 12.0%
D.L.P. 2.0%
FAMILY FIRST 1.6%
DEMOCRATS 1.5%
PEOPLE POWER 1.4%
INDEPENDENT 0.5%
Projected seat allocation:
ALP 2,
Lib 2,
Greens 1
Southern Metropolitan
Districts: Albert Park, Bentleigh, Brighton, Burwood, Caulfield, Hawthorn, Kew, Malvern, Oakleigh, Prahran and Sandringham
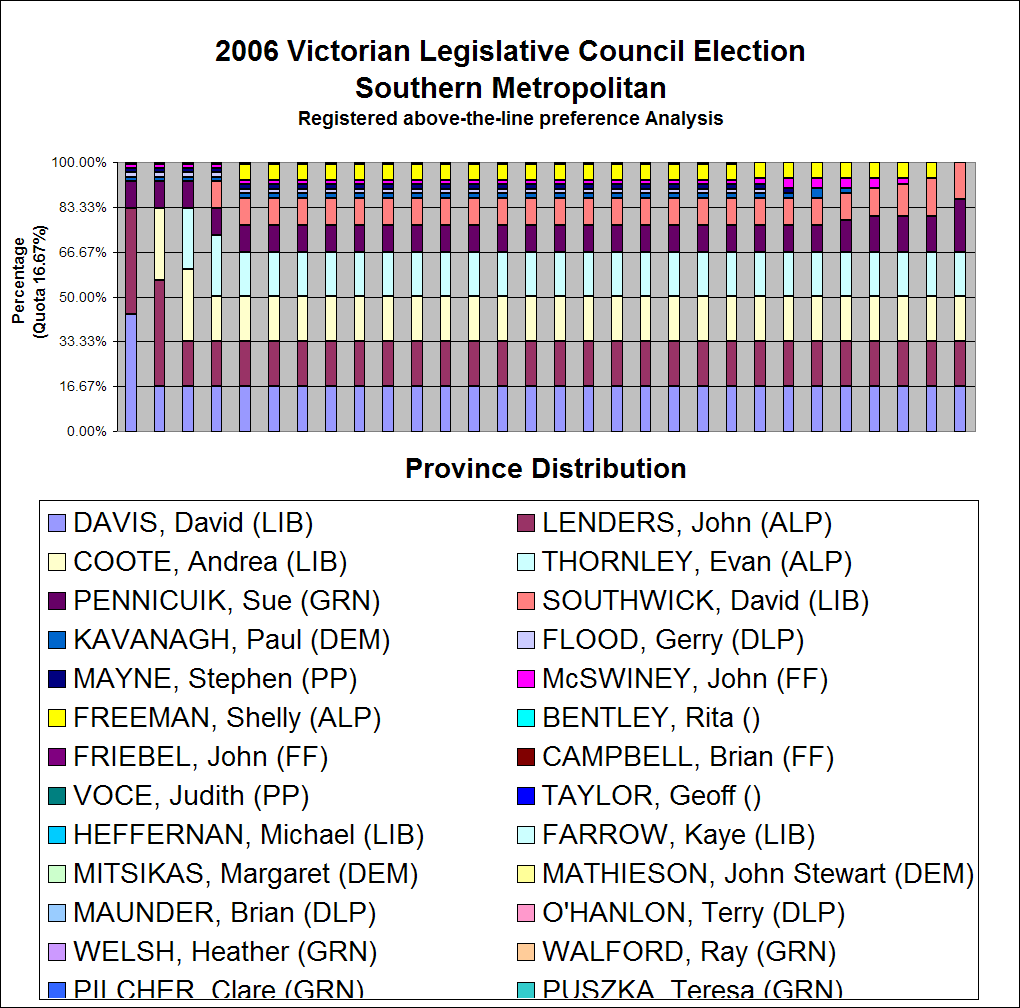
Southern Metropolitan is the other Upper-House seat that crosses Melbourne City's borders. A inner-city bay-side region. The Greens 8% state-wide notionally distributes to just over 10% in this seat helping the Greens survive the count and pick up preferences on the way to winning ahead of the Liberal Party's David Southwick.
Analysis of above-the-line registered preferences based on the recent Newspoll (published in the Australian Newspaper November 11) indicates that this will be the second seat in which the Greens will most likely secure representation.
South Eastern Metropolitan
Districts: Carrum, Clayton, Cranbourne, Dandenong, Frankston, Lyndhurst, Mordialloc, Mount Waverley, Mulgrave, Narre Warren North and Narre Warren South
South Eastern Region's coveted upper-house position has been placed out of contention thanks to the Liberal Party's decision to preference the Greens last.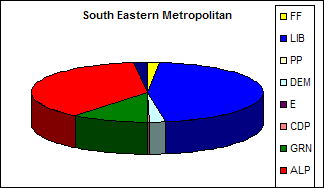 As a result of the Liberal Party's policy they have handed the the fifth seat to the ALP. Had the Liberals referenced the Greens ahead of Labor the Greens would have picked up another seat, having polled only 9.2% (based on Newspoll published in the Australian newspaper November 11) from a Statewide Greens vote of 8%.
The Greens failed to secure sufficient preferences from all other parties and at 12% against Labors remaining 13%, Labor picks up the Liberal surplus vote of 7.5% seeing well over the line and the 16.67% quota.
 Projected seat allocation:
ALP 3 ,
Lib 2
Western Metropolitan
Districts: Altona, Derrimut, Essendon, Footscray, Keilor, Kororoit, Niddrie, Pascoe Vale, Tarneit, Williamstown and Yuroke
A quick look at the Western Metropolitan region which is proving interesting with a close Finnish.
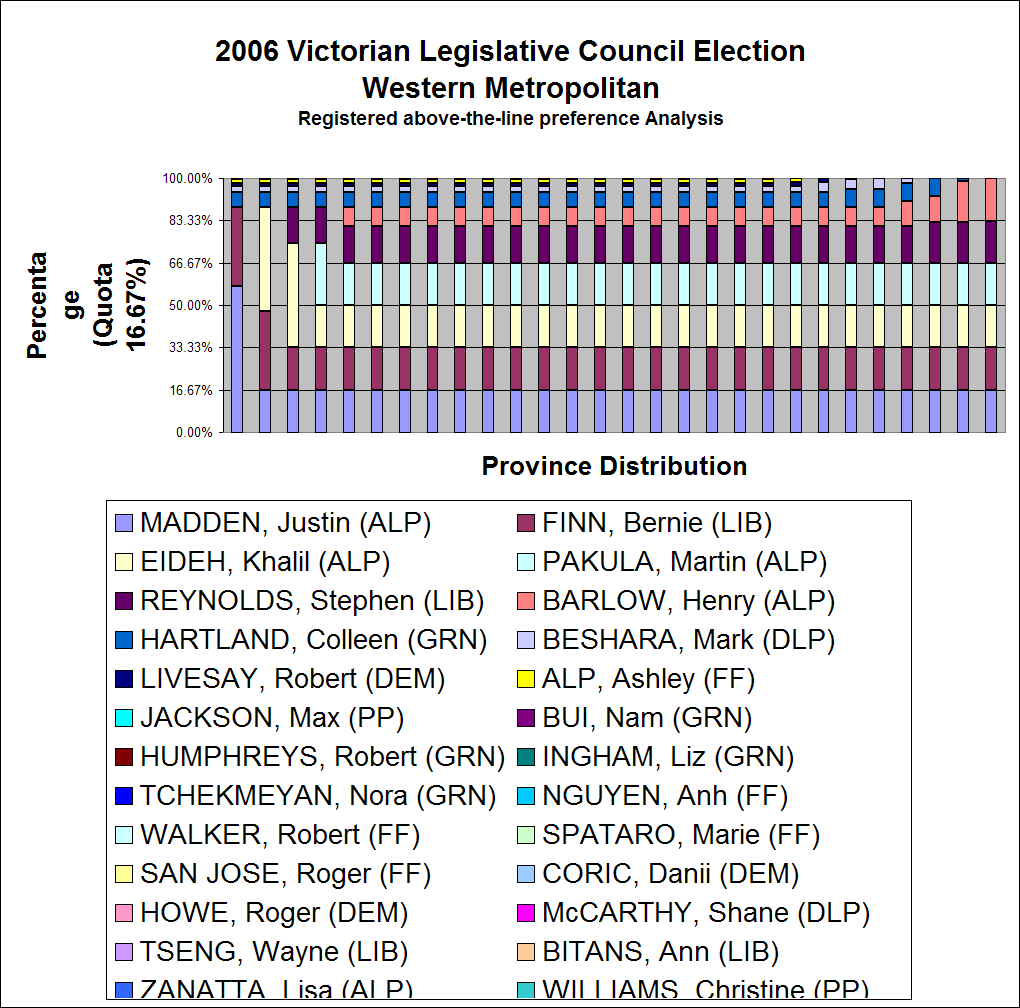
This election shows a potential final battle down to the last five minutes of the game which could move into overtime. It's a match between Labor and the Liberal Party for the final fifth seat. Labor's chances are boosted by the Liberal Party's decision to preference Labor ahead of the Greens and if they campaign well could pick up four out of five upper-house seats. It all depends on if the Liberal Party can cross the line first or if the umpire blows the whistle.
Too close to call and further analysis is required to finalise the outcome.
Its down to points not goals in this match, minor party preferences will count in determining which one (Labor or Liberal) takes the honours and wins the match.
What is clear is that no other party outside the duo comes close to cutting in on the Labor/Liberal toss-up. Labor chances are helped by the "Religious" factor that creeps into Victorian politics. Having its ticket headed by the high priest of Australian Rules Football, Justine Madden helps a significantly in this seat and may just give the ALP that edge of winning that extra position on its home ground.
 The graph below is based on estimated statewide preferences by Newspoll as reported in the Australian Newspaper November 11 showing the ALP (44%), Lib/Nat (40%) and the Greens on (8%. Projected into the Western Metropolitan seat this translates into Labor(57.6%), Liberal (31.04%) and the Greens (5.9%)
Projected seat allocation:
ALP: 3,
Lib: 2
or
ALP: 4,
Lib: 1.
Rural seats
Liberal/National Parties split I have used a Lib/NP split based on information published upperhouse.info
Eastern Victoria (82%/28%)
Northern Victoria (58%/42%)
Western Victoria (85%/15%)
I have not verified this split and would welcome any information that suggests an alternative.
Eastern Victoria
Districts: Bass, Evelyn, Gembrook, Gippsland East, Gippsland South, Hastings, Monbulk, Mornington, Morwell, Narracan and Nepean
Not much surprise here again the issue of concern is the projected split between the Liberal Party and the National Party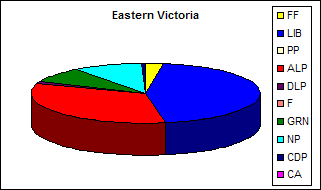 The only other unknown quantity relates to an ALP riff in the Morwell area with a number of disaffected ALP members jumping ship and siding with People Power. This could be a seat in which I have underestimated people power. I need to talk to more people in the days leading up to November 25.
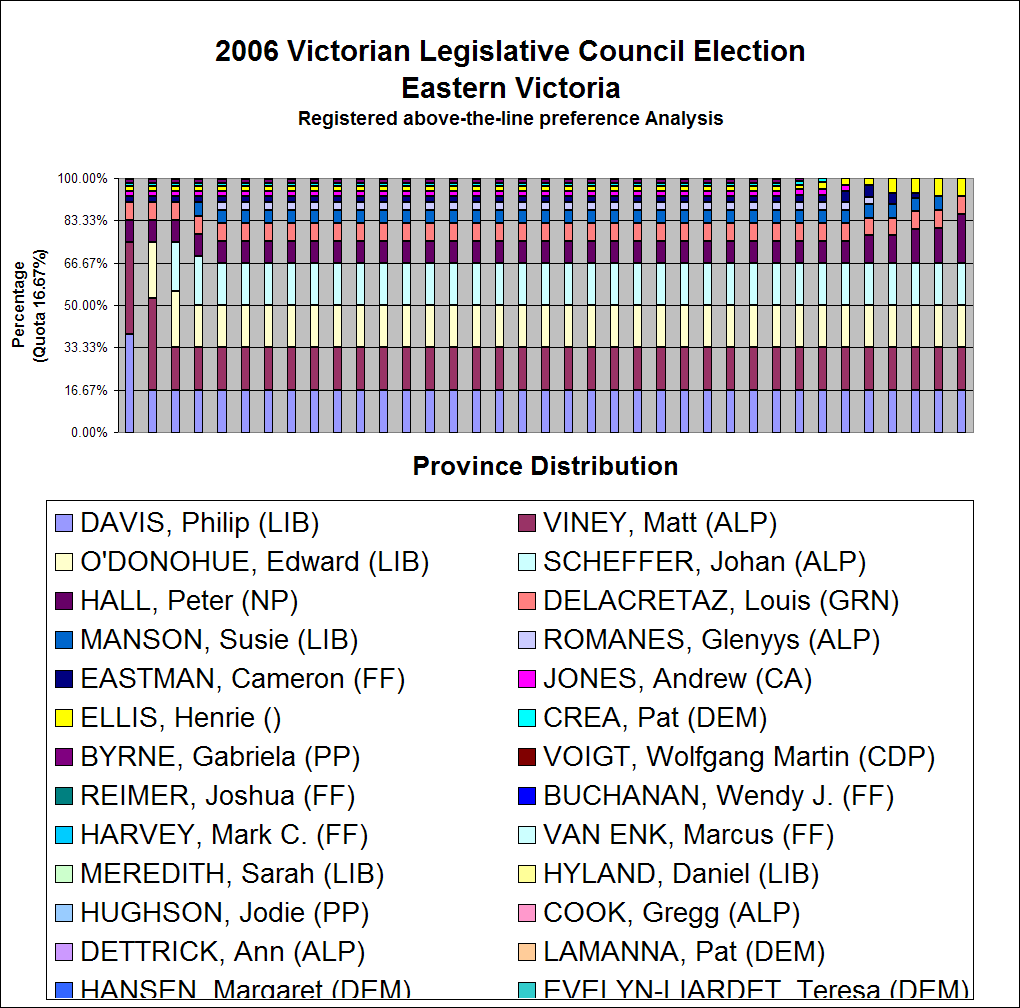
Projected seat allocation
ALP: 2
Lib: 2
NP : 1
Northern Victoria
Districts: Benalla, Benambra, Bendigo East, Bendigo West, Macedon, Mildura, Murray Valley, Rodney, Seymour, Shepparton and Swan HillThis is a that is hard to tell exactly who will top the line for the last position as there is a lot of unknowns. The profile split between the Liberal/NP. Estimated at being (58% Lib 42% NP)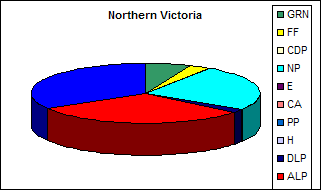 How well the independent group headed by Stephano de Pieri all come into play in the last position. There is a different local issues crossing the northern end and along the Murray Valley. It ranges from Mildura and across the Victorian Alpines and as such the demographics and issues effecting each area is diverse. It is one of the National Parties strong holds and yes they win a seat in the red morgue house which could become the living dead.

Projected seat allocation:
ALP: 2
Lib: 2
NP : 1
Western Victoria
Districts: Ballarat East, Ballarat West, Bellarine, Geelong, Lara, Lowan, Melton, Polwarth, Ripon, South Barwon and South-West Coast
This is another Cliff hanger and could very well go the way of the twelve apostles as the NP vote erodes.
 The fight for the last seat is extremely close (which means I have to spend time homing in my analysis) with a fight to the death between the ALP and National Party. Again the results of this Analysis is based on a Liberal/National Party split of 85% Lib 15% NP.
Unlike other analysis out there I have not doubled Family First's vote and expect they will get close to what they obtained in the Senate where there was suplus percentages we increased Family First marginally. Also it is unlikely that the DLP will secure more votes then they obtained during the 2004 senate. In therory it is possib;e that if Family First can gain around 4% of the vote then the DLP could leap-frog out to win the seat but as stated I do not believe Family First will double their vote. There is more chance of the Catholics , the Protestants uniting before Family First attract wide support.
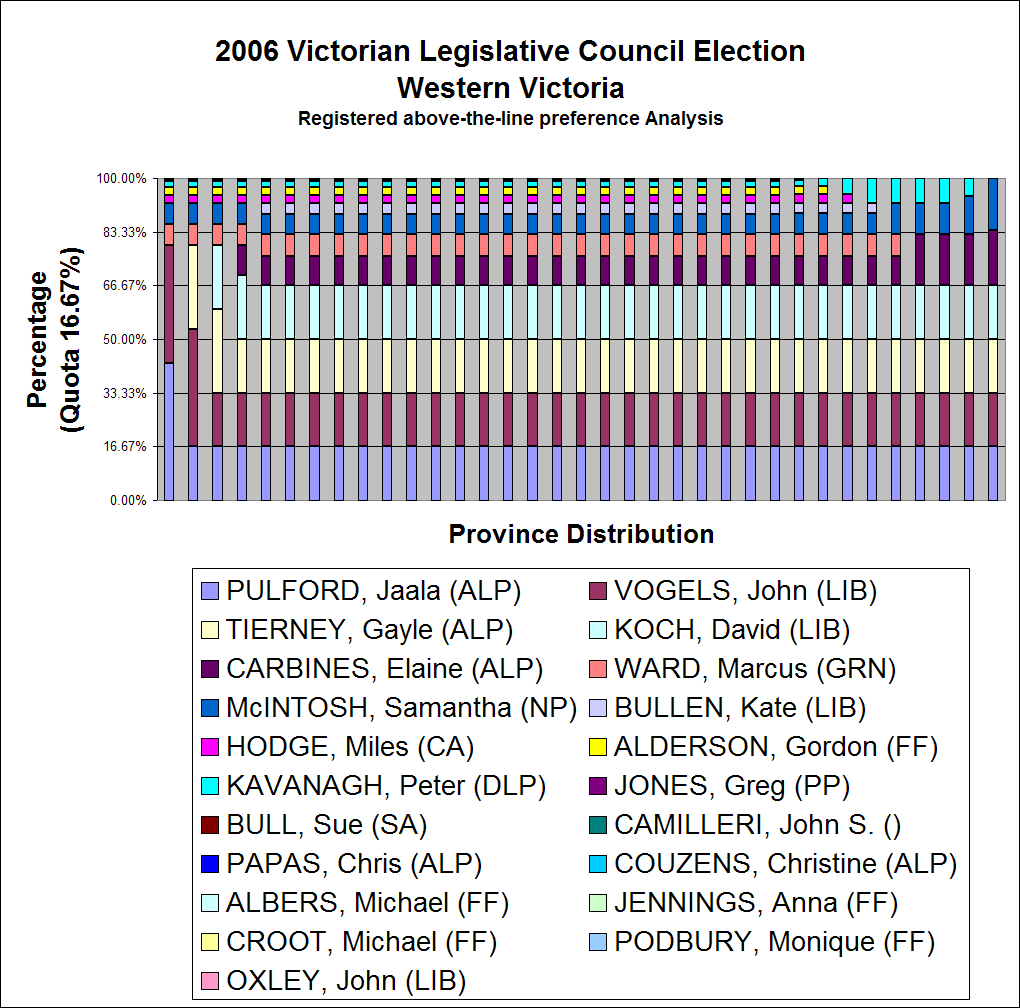
I will try and find time and update my analysis when ready. I have published the graph below for completeness of information but readers should take it with a note of caution.
Projected seat allocation:
ALP: 2* or 3
Lib: 2
NP: * 1 (Note too close to call).
Subscribe to:
Posts (Atom)